
Figure 9.
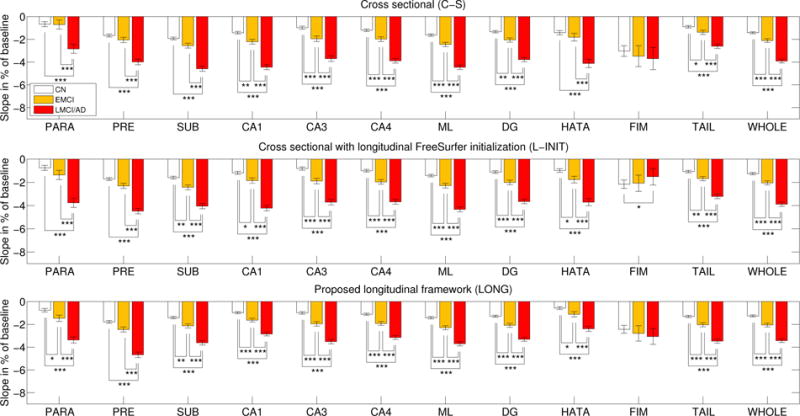
ADNI dataset: atrophy rates (percentage of baseline, per year) for the hippocampal subregions of the right hemisphere. See caption of Figure 8 for an explanation of this figure.
Official websites use .gov
A
.gov website belongs to an official
government organization in the United States.
Secure .gov websites use HTTPS
A lock (
) or https:// means you've safely
connected to the .gov website. Share sensitive
information only on official, secure websites.
ADNI dataset: atrophy rates (percentage of baseline, per year) for the hippocampal subregions of the right hemisphere. See caption of Figure 8 for an explanation of this figure.