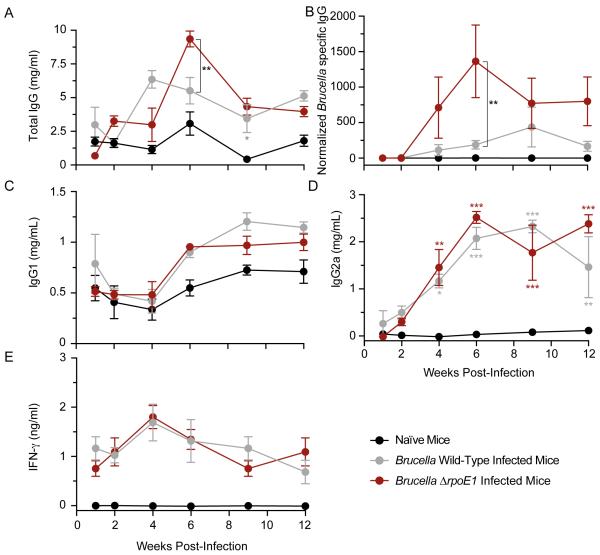
Figure 4. Antibody and cytokine quantification in wild-type and ΔrpoE1-infected mouse sera.
Mouse serum was harvested at 1, 2, 4, 6, 9, and 12 weeks post-infection from naïve-control mice, WT-, or ΔrpoE1-infected mice. Amounts of total IgG (A) Brucella-specific IgG (B) IgG1 (C) IgG2a (D) and IFN-γ (E) were determined by ELISA (see Materials and Methods for details). Data presented are from naïve mice (black circle), WT-infected mice (grey circle), or ΔrpoE1-infected mice (red circle). Each data point (n = 5) is the mean ± the standard error of the mean. Unless otherwise indicated, one-way ANOVA was followed by a Bonferroni post test to assess the significance in the mean differences between naïve mice and WT- or ΔrpoE1-infected mice. NS = not significant, (*) = P<0.05, (**) = P<0.01, (***) = P<0.001, (****) = P < 0.0001.

