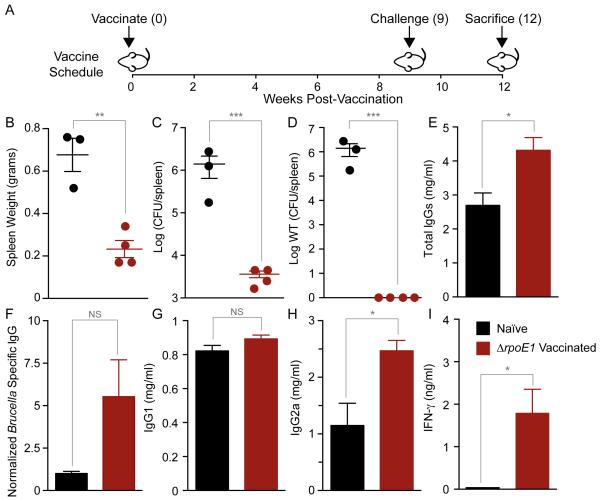
Figure 5. Analysis of splenomegaly, bacterial burden, antibody, and cytokine profiles in ΔrpoE1-vaccinated mice.
Naïve age-matched control mice or ΔrpoE1-vaccinated mice were infected with WT Brucella 9 weeks post-vaccination (A). Spleen weights (B), total Brucella burden (C), and WT Brucella (D) were determined for each spleen. Quantitative ELISAs were performed to analyze serum levels of total IgG (E), Brucella-specific IgG (F), IgG1 (G) IgG2a (H), and IFN-γ (I). For vaccination studies, naïve mice (n = 3) are colored black and ΔrpoE1-vaccinated mice (n = 4) are colored red. Data presented are the mean ± SEM. T-tests were performed between naïve and ΔrpoE1-vaccinated mice. NS = not-significant, (*) = P<0.05, (**) = P<0.01, (***) = P<0.001, (****) = P < 0.0001.

