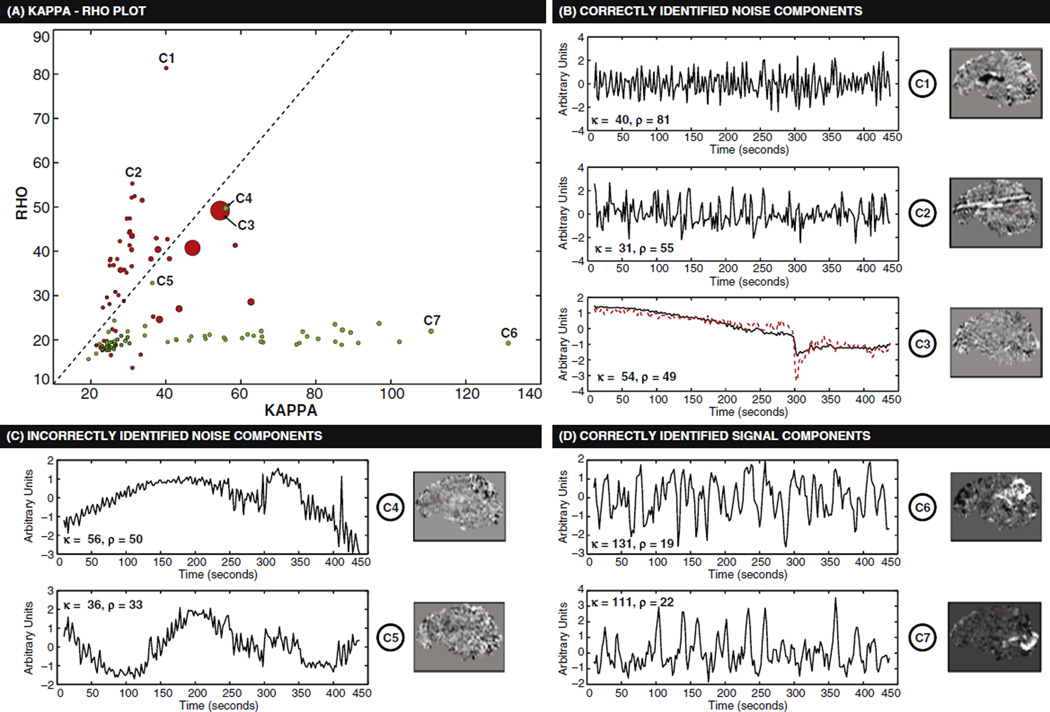
Fig. 12.
(A) Kappa – Rho spectrum for the ME-ICA decomposition of a representative subject that participated in the rapid event-related experiments. Each dot represents a component. The color of the dot indicates whether the component was marked as noise by the ME-ICA algorithm (red) or not-noise (green). The size of the dots is proportional to the amount of variance explained by the component. A dashed black line indicates locations in the plane where kappa equals rho. (B) Time series and spatial maps for three different noise component correctly identified as noise by ME-ICA. For the particular case of component C3, the component had high temporal correlation (r = 0.87) with traces of head displacement in the AP direction (dashed red line). (C) Time series and spatial maps for two noise components incorrectly identified as BOLD by ME-ICA. (D) Time series and spatial maps for two BOLD components correctly identified by ME-ICA. For all components a label or black arrow indicates its location in the kappa-rho spectrum (A).

