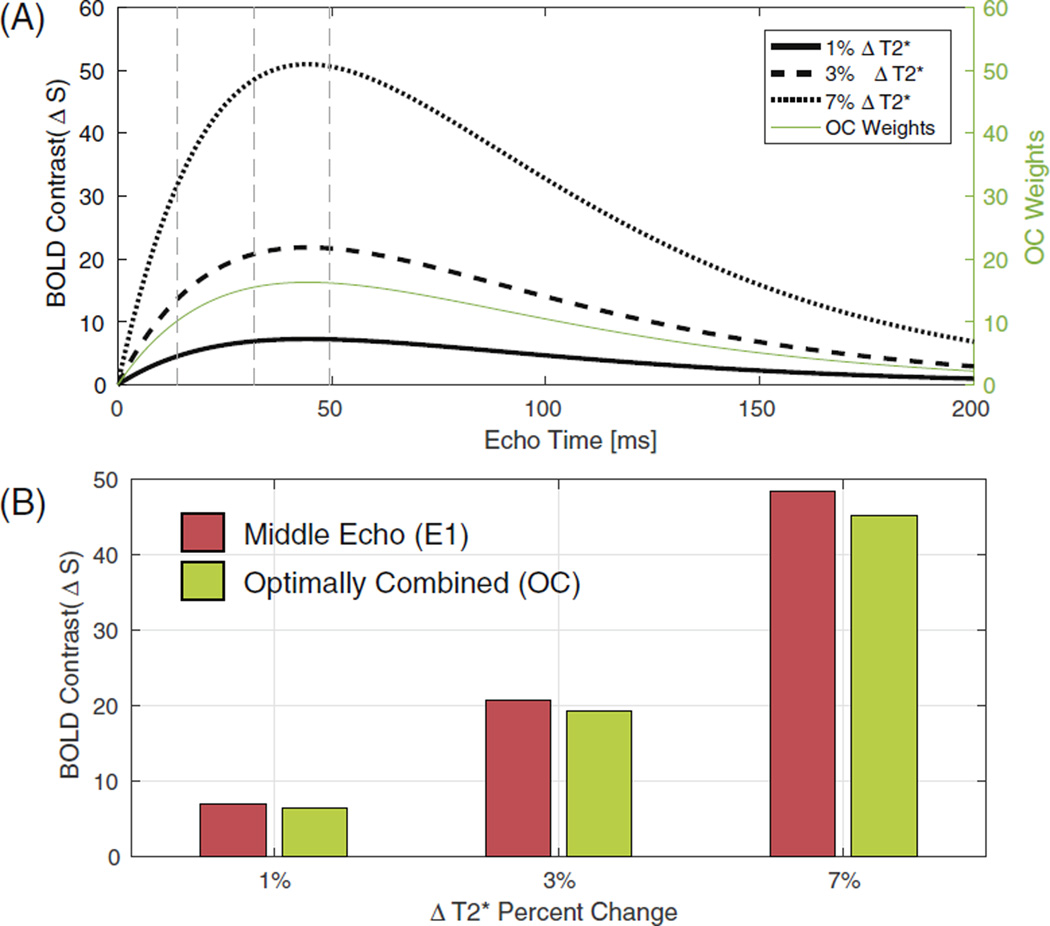
Fig. 2.
(A) Simulated BOLD contrast curves for echo times ranging from 0 to 200 ms for three different amounts of task-induced ΔT2* (i.e., 1%, 3% and 7%; black curves). Estimated OC weights according to Eq. (1) for the same range of echo times are shown in green. (b) Simulated effect size (i.e., BOLD contrast) for the 1E and OC pipelines for the three different ΔT2* scenarios.

