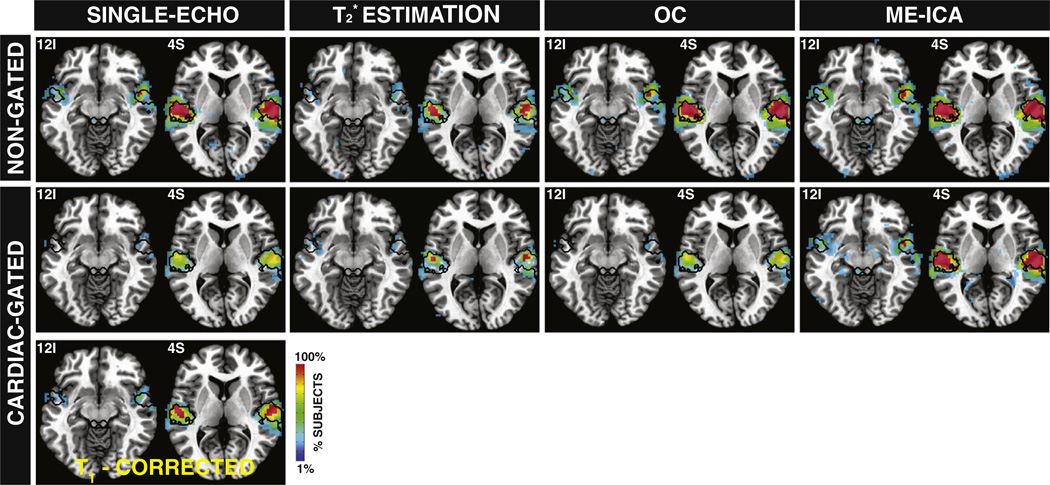
Fig. 5.
Probabilistic maps of activation across subjects for all pre-processing pipelines for both acquisition schemes (cardiac-gated and non-gated). The color of a voxel indicates the percentage of subjects for which that voxel became significant at pFDR < 0.05. In all instances, activity was detected in portions of the superior temporal gyrus. IC activation was present more consistently across subjects only for the ME-ICA pipeline (see Tables 1A and B). Target ROIs are shown with a black contour.

