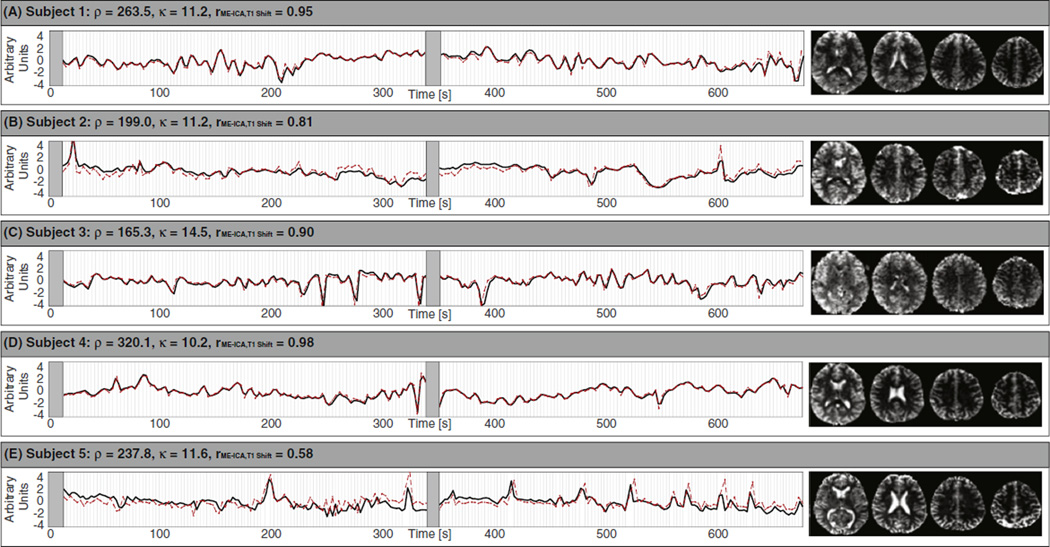
Fig. 7.
ME-ICA components marked as noise and showing the largest correlation with the estimation of T1-related signal changes derived from irregular TR in cardiac-gated acquisitions. For each subject we show the ME-ICA component spatial map on the right, its associated time series in black and the estimation of T1-related signal change for that subject in dashed red. All time series are normalized (mean of zero and standard deviation of one) so that similarities in shape can be better visualized. Light grey vertical lines indicate actual acquisition times of the MRI volumes. Dark grey rectangles signal the times associated with discarded volumes at the beginning of each run. (For interpretation of the references to color in this figure legend, the reader is referred to the web version of this article.)

