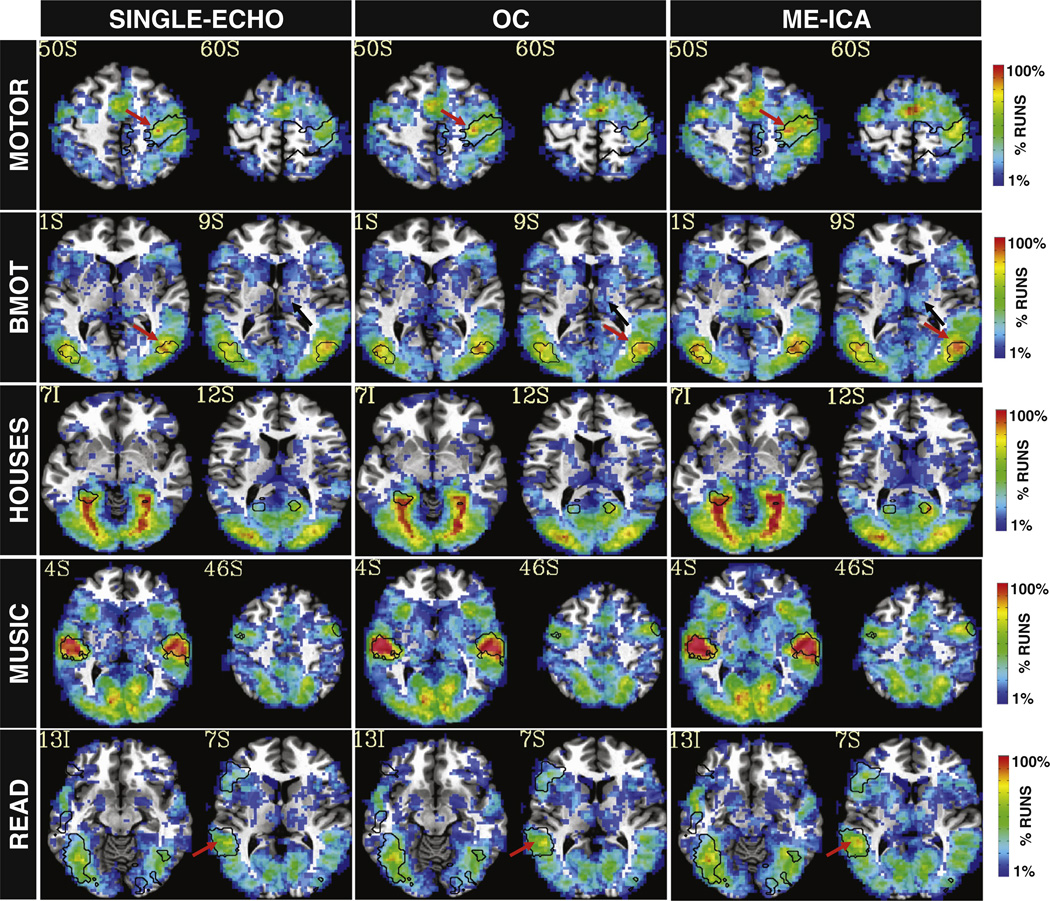
Fig. 8.
Probabilistic maps of activation across runs for the per-task (rapid event-related) analysis for all five tasks and three pre-processing pipelines. While a total of 16 runs contributed to the probabilistic maps for the BMOT, HOUSES, MUSIC and READ tasks, only13 did for the MOTOR task. These 13 activation maps correspond to the runs in which subjects were instructed to use their left hand. Black contours show the target ROIs for each particular task. Colored arrows point at locations where ME-ICA resulted in greater consistency of activation across subjects inside (red) and outside (black) the target ROIs.

