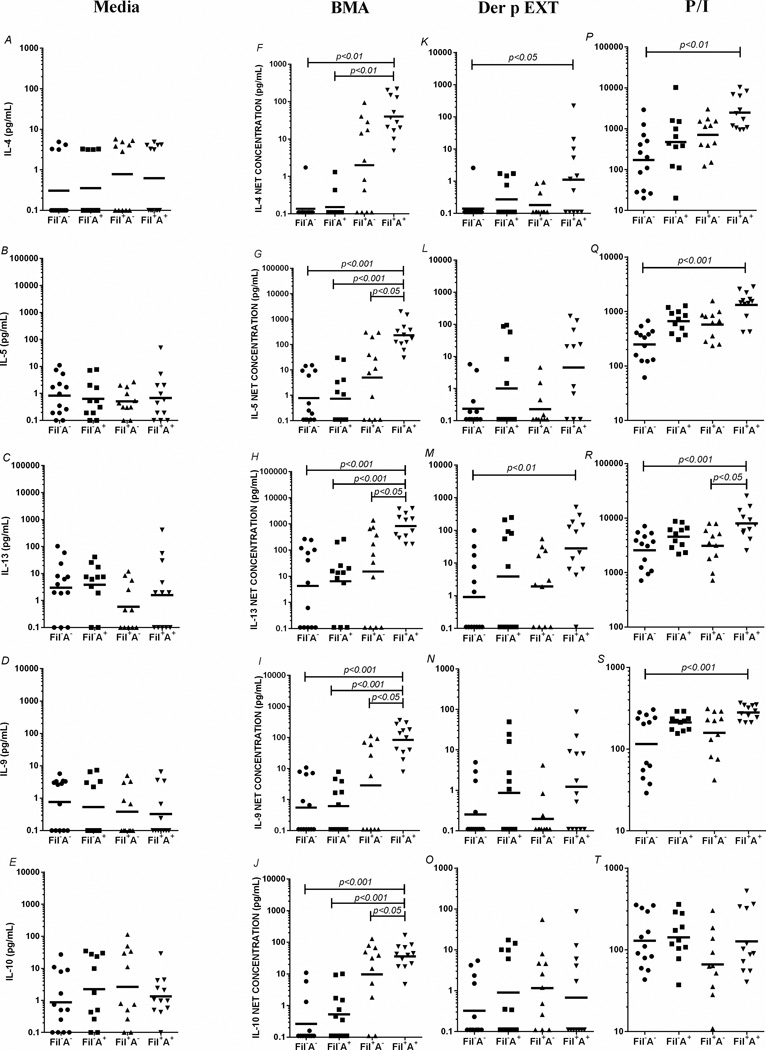
Figure 1. Th2-associated cytokines driven by parasite antigens, allergens and mitogen in the filarial-infected individuals with or without coincident allergic sensitization.
In vitro production of IL-4 (A,F,K,P), IL-5 (B,G,L,Q), IL-13 (C,H,M,R), IL-9 (D,I,N,S) and IL-10 (E,J,O,T) at baseline (A–E) and after stimulation by filaria antigen (F–J), Der p Ext (K–O) and P/I (P–T) in the 4 groups (FIL−A−, Fil−A+, Fil+A−, Fil+A+). Each dot represents a single individual and the horizontal bars are the geometric mean (GM). Net production of cytokines (in pg/ml) calculated by subtracting the baseline level from the level following stimulation.

