Figure 2.

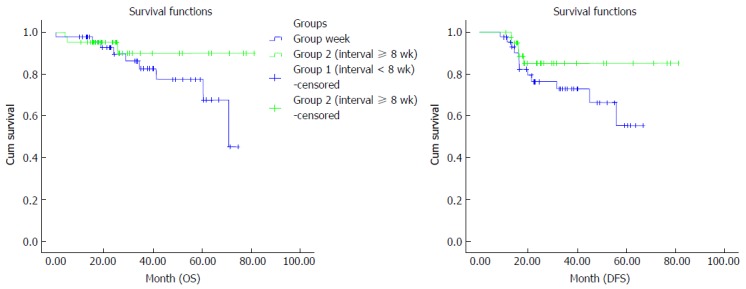
Comparison of overall survival and disease-free survival between the groups by Kaplan–Meier curves. The median DFS duration in group II was better than in group I (P = 0.01). DFS: Disease-free survival; OS: Overall survival.

Comparison of overall survival and disease-free survival between the groups by Kaplan–Meier curves. The median DFS duration in group II was better than in group I (P = 0.01). DFS: Disease-free survival; OS: Overall survival.