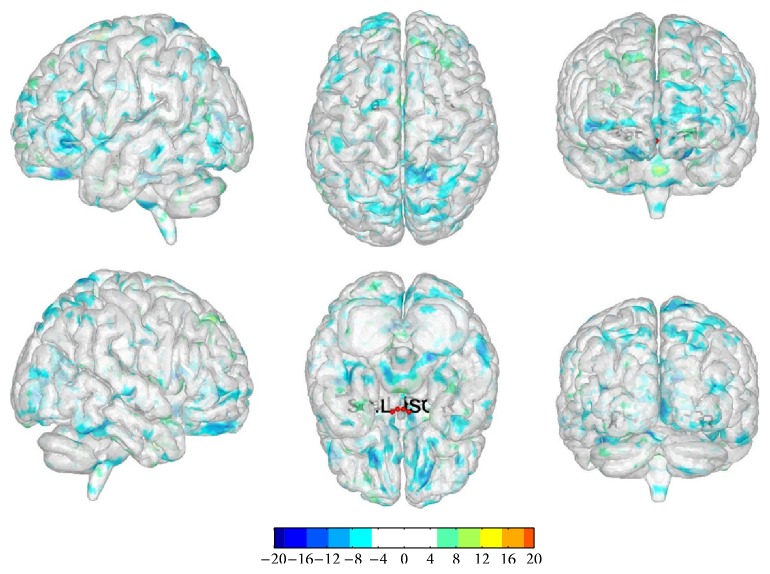
Figure 4.
The changes in functional connectivity before and after once acupuncture in sham group. Note: the color bar represents intensity and red dots represent the seeds of SO and Pa. L is short for left and R is short for right. The single map represents change in functional connectivity obtained from combining results from all four seed points.

