Figure 4.
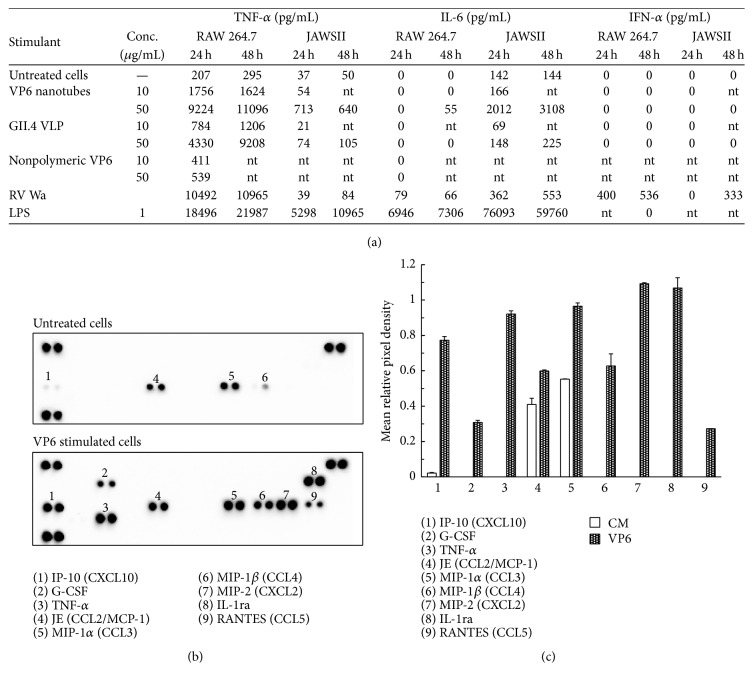
Cytokine production in the supernatants of RAW 264.7 and JAWSII cells. (a) The quantity (pg/mL) of TNF-α, IL-6, and IFN-α in the supernatants of RAW and JAWSII cells incubated for 24 h or 48 h with 10 μg/mL and 50 μg/mL of VP6 nanotubes, NoV GII.4 VLPs, or nonpolymeric VP6. RV Wa, LPS, and culture media only (untreated cells) served as controls. Zero values indicate that the result was below the lowest standard dilution of the assay (62.5 pg/mL for TNF-α, 15.6 pg/mL for IL-6, and 12.5 pg/mL for IFN-α). nt = not tested. Shown are the mean values of analysis done at least twice with independent samples. (b) The mouse cytokine multiplex array analysis of RAW 264.7 supernatants after 24 h stimulation with VP6 nanotubes (100 μg/mL) or fresh culture media (untreated cells). (c) The pixel densities ± SD of the replicates for each visible spot on the arrays, calculated using ImageJ software and plotted.

