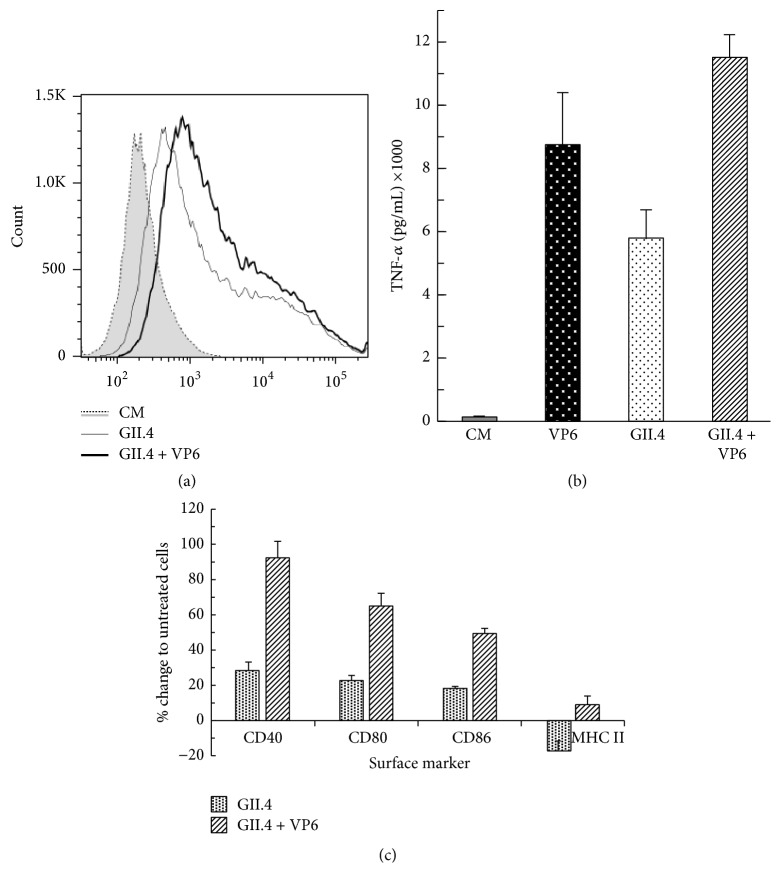
Figure 6.
Internalization and activating/maturating effect of NoV GII.4 VLPs alone or combined with RV VP6 nanotubes on RAW 264.7 cells. (a) Flow cytometry analysis of GII.4 VLPs uptake by RAW 264.7 cells after 24 h incubation with 100 μg/mL of GII.4 VLPs alone or mixed with 100 μg/mL of VP6 nanotubes. The intracellular staining of untreated cells (CM), GII.4 VLP treated cells, and GII.4 + VP6 treated cells, of a representative experiment of two independent analyses, is shown. (b) The level of TNF-α in cell-culture supernatants as measured by ELISA after 24 h incubation with 100 μg/mL of GII.4 VLPs alone, 100 μg/mL VP6 alone, or GII.4 VLPs mixed with 100 μg/mL of VP6 nanotubes. Shown are the mean values and standard deviations of two independent analyses. (c) The expression of cell surface markers measured by flow cytometry after 24 h stimulation. The results represent % increase or decrease of the MFI of each marker on the cells incubated with GII.4 VLPs alone or with combined GII.4 VLPs and VP6 nanotubes compared to baseline level of untreated cells. The mean values with standard deviations of two independent analyses are presented.

