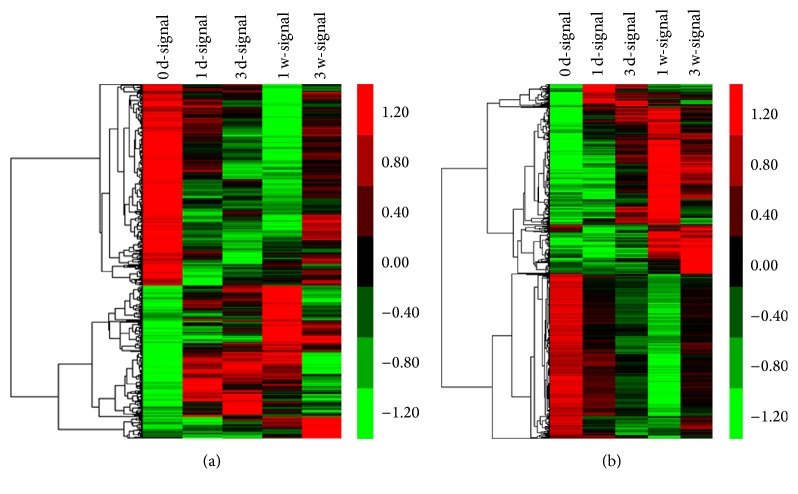
Figure 1.
Heat maps and hierarchical clustering showed a remarkable differential expression of LncRNAs (a) and mRNAs (b) at five continuous time points after SCI. Red and green represented the high and low expression levels, respectively. Black indicated the mean expression levels. Each column represented a single group, and each row represented an LncRNA.

