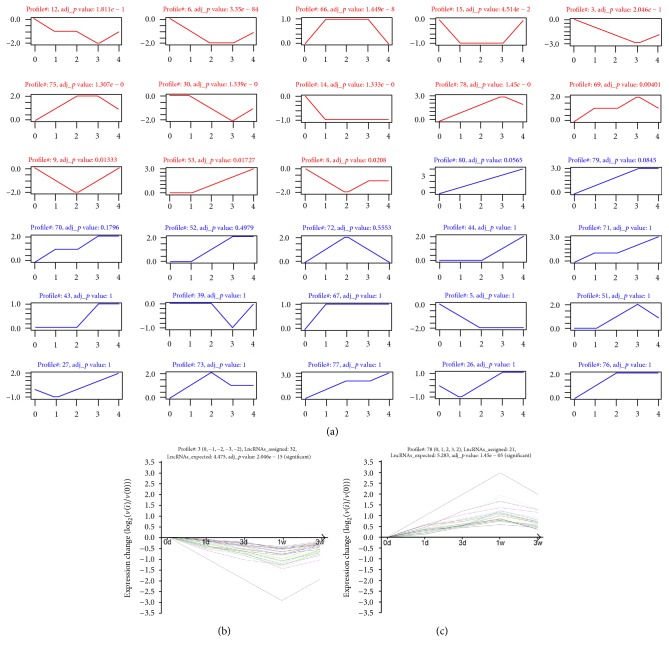
Figure 4.
STC analysis for differential expression mRNAs related to SCI. (a) as is similar to Figure 3; it represents the expression patterns of these differential expression mRNAs. The coordinate axis and upper number were the same as Figure 3(a). (b and c) Two typical significant profiles were chosen to show the specific pattern of mRNAs expression. As an analogy to Figures 3(b) and 3(c), the coordinate axis and upper number were the same.

