
Fig. 1.
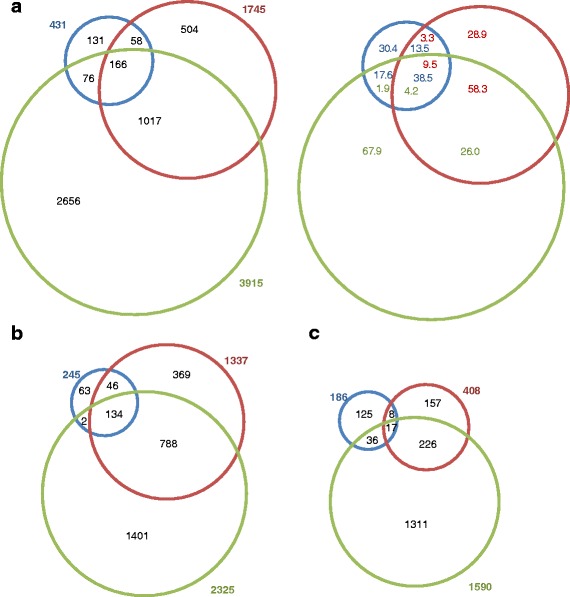
Overlap of genes whose expression is affected at the three time points. Venn diagrams showing the overlap of (a) affected (P < 0.05 and log2 ≥ 1 or ≤ -1) genes between 30 min (blue), 1 h (red) and 9 h (green) in absolute values (left) and percentages (right), (b) induced genes and (c) repressed genes