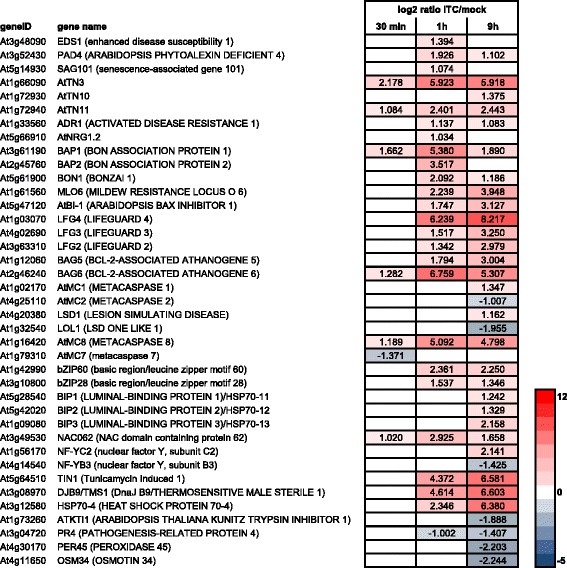
Fig. 12.

Cell death-related genes affected by allyl-ITC. Changes in expression levels (log2 ratios) of genes involved in cell death mechanisms after 30 min, 1 h and 9 h of allyl-ITC treatment, compared to mock treatment. Only values for genes significantly affected at one time point at least are indicated. The colour scale goes from blue (downregulated by allyl-ITC) to red (upregulated by allyl-ITC) and the extremes are set to cover the range of the log2 ratios for the most affected genes in the whole dataset. Genes are listed in the order they are described in the text
