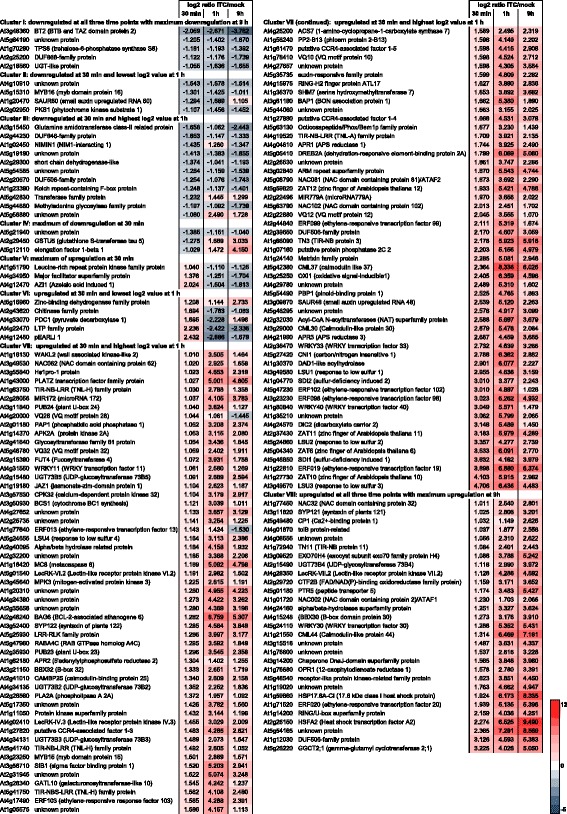
Fig. 2.

Dynamics of the allyl-ITC response. Genes significantly affected by the allyl-ITC treatment at all three time points are clustered based on the changes in log2 ratios ITC/mock between time points. The colour scale goes from blue (downregulated by allyl-ITC) to red (upregulated by allyl-ITC) and the extremes are set to cover the range of the log2 ratios for the most affected genes in the whole dataset
