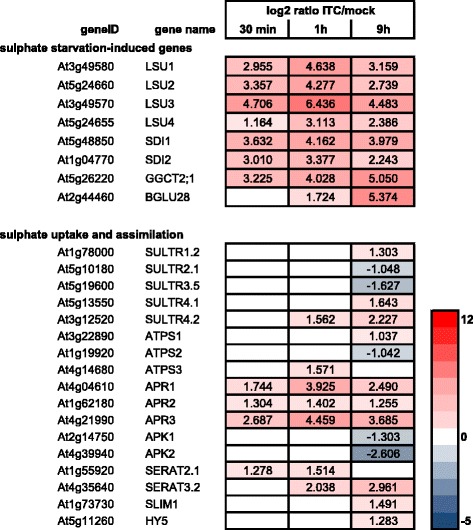
Fig. 6.

Effect of allyl-ITC on sulphur response. Changes in expression levels (log2 ratios) of selected sulphur starvation-induced genes and of genes involved in sulphate uptake and assimilation after 30 min, 1 h and 9 h of allyl-ITC treatment, compared to mock treatment. Only values for genes significantly affected at one time point at least are indicated. The colour scale goes from blue (downregulated by allyl-ITC) to red (upregulated by allyl-ITC) and the extremes are set to cover the range of the log2 ratios for the most affected genes in the whole dataset
