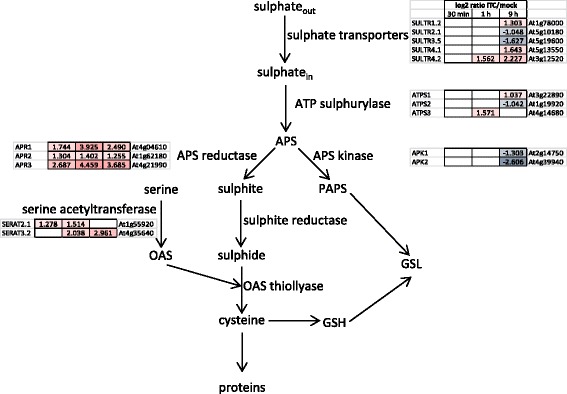
Fig. 7.

Diagram of the allyl-ITC effect on sulphate uptake and assimilation. Diagram showing gene expression changes (log2 ratios) in the early steps of sulphate uptake and assimilation after 30 min, 1 h and 9 h exposure to allyl-ITC. ATPS: ATP sulphurylase, APS: adenosine 5′-phosphosulphate, PAPS: 3′-phosphoadenosine 5′-phosphosulphate, APK: APS kinase, APR: APS reductase, SERAT: serine acetyltransferase, OAS: O-acetylserine, GSH: glutathione, GSL: glucosinolates
