Fig. 2.

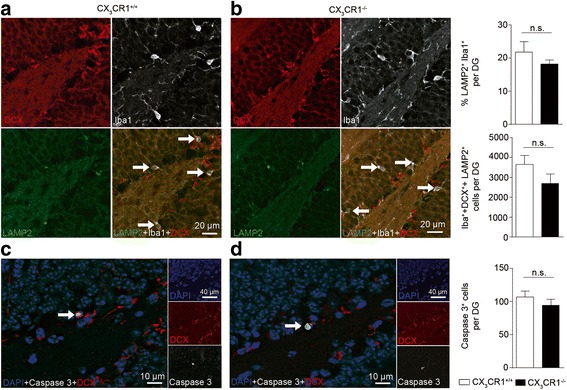
Reduced cell number of DCX+ cells in the DG of cx3cr1 −/− mice is not due to increased microglial phagocytosis or DCX+ cell apoptosis. a Representative coronal DG sections from cx3cr1 +/+ (a) and cx3cr1 −/− mice (b) immunostained for the microglia marker Iba1 (white), the phagocytosis marker lysosome-associated membrane protein 2 (LAMP2, green) and DCX (red) labeling proliferating cells and young developing neurons. Quantification of LAMP2+Iba1+ cells (top right) (p = 0.3957, two-tailed Student’s t-test, cx3cr1 +/+ (n = 12) vs. cx3cr1 −/− (n = 8)) or of Iba1+DCX+LAMP2+ cells (middle right) (p = 0.1551, two-tailed Student’s t-test, cx3cr1 +/+ (n = 8) vs. cx3cr1 −/− (n = 8)) showed no significant difference between both mouse lines. Similar numbers of apoptotic cells were detected by an active caspase 3 marker (white) co-stained with DAPI (blue) and DCX (red) in the DG of cx3cr1 +/+ (c) and cx3cr1 −/− mice (d) (p = 0.3406, two-tailed Student’s t-test, cx3cr1 +/+ (n = 13) vs. cx3cr1 −/− (n = 13)) as depicted in the bar graph (bottom right). One representative experiment of two is shown. Bars represent mean ± SEM; n.s., not significant
