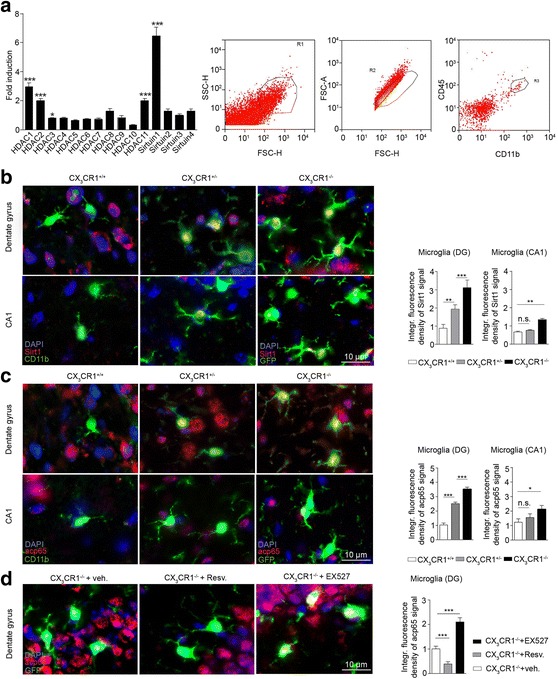
Fig. 3.

Enhanced microglial SIRT1 expression and acetylation of p65 in the DG of cx3cr1 −/− mice. Flow cytometric analysis based on cell size and granularity identified hippocampal microglia from cx3cr1 +/+ and cx3cr1 −/− mice with CD11bhigh/CD45pos expression (a, FACS blots to the right). No significant induction of mRNA levels was found for HDAC4-HDAC10 and sirtuin2-sirtuin4 when cx3cr1 −/− mRNA levels were divided by mRNA levels found in cx3cr1 +/+ microglia (p > 0.05, two-tailed Student’s t-test, cx3cr1 +/+ (n = 6) vs. cx3cr1 −/− (n = 6)) (a, bar graph). HDAC1-HDAC3, HDAC11 and sirtuin1 mRNA levels were significantly higher in hippocampal microglia from cx3cr1 −/− mice compared to cx3cr1 +/+ mice (a, bar graph). Bars represent normalized mRNA expression of cx3cr1 −/− microglia (n = 6) in fold over cx3cr1 +/+ microglia (n = 6, ***p < 0.001; *p < 0.05) (b) Immunostaining of coronal DG (upper row) and CA1 (lower row) sections from cx3cr1 +/+ (left), cx3cr1 +/− (middle) and cx3cr1 −/− (right) mice for DAPI (blue), Sirt1 (red) and CD11b (green). In cx3cr1 +/− and cx3cr1 −/− mice microglia were labeled with GFP (green). In the DG area the integrated Sirt1 fluorescence signal was increased in cx3cr1 +/− microglia compared with the signal found in cx3cr1 +/+ microglia (p = 0.0031, two-tailed Student’s t-test, cx3cr1 +/+ (n = 4) vs. cx3cr1 +/− (n = 7)) and even more intense in cx3cr1 −/− when compared to cx3cr1 +/− microglia (p < 0.001, two-tailed Student’s t-test, cx3cr1 +/− (n = 6) vs. cx3cr1 −/− (n = 7)). In the CA1 region cx3cr1 −/− microglial Sirt1 staining was found to be only slightly increased (p = 0.0021, two-tailed Student’s t-test, cx3cr1 +/+ (n = 6) vs. cx3cr1 −/− (n = 6)) while there was no difference in the Sirt1 signal when comparing cx3cr1 +/− and cx3cr1 +/+ microglia (p = 0.7641, two-tailed Student’s t-test, cx3cr1 +/+ (n = 6) vs. cx3cr1 +/− (n = 5)). Bars represent the integrated fluorescence density of the Sirt1 signal in microglia of cx3cr1 +/− and cx3cr1 −/− mice relative to the Sirt1 signal in DG cx3cr1 +/+ microglia (b, bar graphs to the right). c Immunostaining for microglial acetylated p65 (red) in the hippocampal DG (upper row) and CA1 region (lower row) of the same mouse strains revealed the strongest signals in the DG of cx3cr1 +/− (p = 0.0002, two-tailed Student’s t-test, cx3cr1 +/+ (n = 6) vs. cx3cr1 +/− (n = 5)) and cx3cr1 −/− mice (p = 0.0001, two-tailed Student’s t-test, cx3cr1 +/− (n = 5) vs. cx3cr1 −/− (n = 7)). There was only a mildly increased acp65 signal in CA1 microglia from cx3cr1 −/− mice (p = 0.0149, two-tailed Student’s t-test, cx3cr1 +/+ (n = 5) vs. cx3cr1 −/− (n = 6)). Signal intensity for microglial acp65 was indistinguishable in cx3cr1 +/− and cx3cr1 +/+ mice (p = 0.1555, two-tailed Student’s t-test, cx3cr1 +/+ (n = 5) vs. cx3cr1 −/− (n = 5)) (c, bar graphs to the right). d Immunostaining for acp65 in cx3cr1 −/− microglia was significantly reduced in cx3cr1 −/− mice pretreated with resveratrol (p < 0.001, two-tailed Student’s t-test, cx3cr1 −/− + vehicle (n = 7) vs. cx3cr1 −/− + resveratrol (n = 7)) and increased following EX527 treatment (p = 0.0002, two-tailed Student’s t-test, cx3cr1 −/− + vehicle (n = 7) vs. cx3cr1 −/− + EX527 (n = 7)). One representative experiment of two is shown. Bars represent mean ± SEM; n.s., not significant. ***p < 0.001; **p < 0.01; *p < 0.05
