Fig. 4.

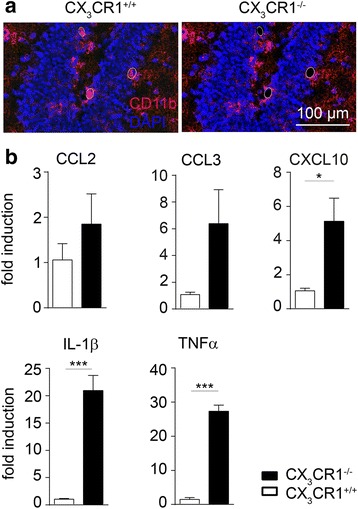
Increased cytokine expression in cx3cr1 −/− microglia isolated from DG. a CD11b positive cells were lasermicrodissected from the DG area and RNA was isolated for real-time PCR. b RT-PCR experiments showed that CCL2 (p = 0.354, two-tailed Student’s t-test, cx3cr1 −/− (n = 5) vs. cx3cr1 +/+ (n = 4)) and CCL3 (p = 0.107, two-tailed Student’s t-test, cx3cr1 −/− (n = 5) vs. cx3cr1 +/+ (n = 4)) expression was similar in microglial RNA from cx3cr1 +/+ and cx3cr1 −/− mice. Significantly increased expression level of CXCL10 (p = 0.013, two-tailed Student’s t-test, cx3cr1 −/− (n = 5) vs. cx3cr1 +/+ (n = 4)), TNF-α (p = 0.0001, two-tailed Student’s t-test, cx3cr1 −/− (n = 5) vs. cx3cr1 +/+ (n = 4)) and IL-1β (p = 0.0004, two-tailed Student’s t-test, cx3cr1 −/− (n = 5) vs. cx3cr1 +/+ (n = 4)) mRNA were detected in cx3cr1 −/− mice. One representative experiment of two is shown. Bars represent mean ± SEM; n.s., not significant. ***p < 0.001; *p < 0.05
