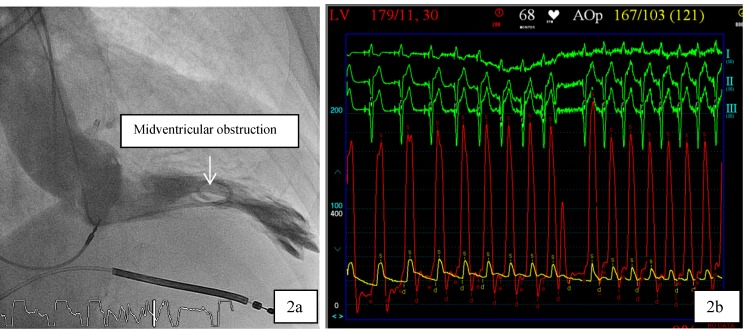
Figure 2.
a,b: 2a. In patient 1, cardiac catheterization with levocardiogram shows midventricular obstruction. 2b: From the top to the bottom surface ECG leads I, II, III. Red Curve: Left ventricular (LV) Pressure, yellow curve: Aortic pressure. The tracings demonstrate the Brockenbrough-Braunwald-Morrow sign in HOCM patients as the LV-pressure increases significantly in the post extrasystole period.

