Figure 1.
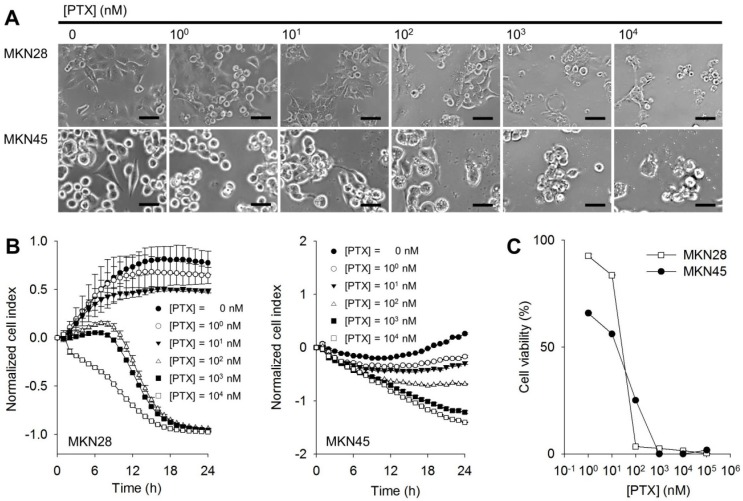
Chemo-sensitivity of PTX on gastric cancer cell lines. (A) Cellular microscopic images for MKN28 and MKN45 cells at 24 h after addition of PTX. Scale bars mean 50 μm. (B) Proliferation profiles for MKN28 (left) and MKN45 (right) cells obtained by the RTCA after 24 h from PTX treatments (0 - 104 nM, 1:10 serial dilutions). All graphs represent three independent experiments and with standard deviations (n = 3). (C) Cell viabilities for MKN28 and MKN45 cells calculated from (B) at 24 h from PTX treatment.

