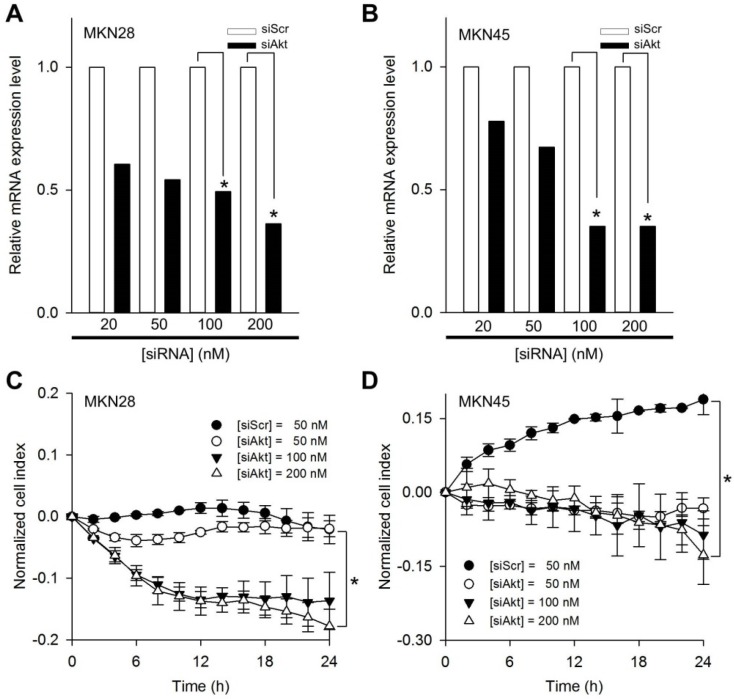
Figure 2.
Effects of siAkt on gastric cancer cell lines. Relative Akt mRNA expression levels as a function of siScr and siAkt in a dose-dependent manner for (A) MKN28 and (B) MKN45 cells. Proliferation profiles monitored by RTCA for (C) MKN28 and (D) MKN45 cells treated with 50 nM of scrambled siRNA (siScr) and 50, 100, and 200 nM of siAkt, respectively. The normalized cell index was calculated every 2 h. All graphs represent three independent experiments and with standard deviations (n = 3). *p<0.01.

