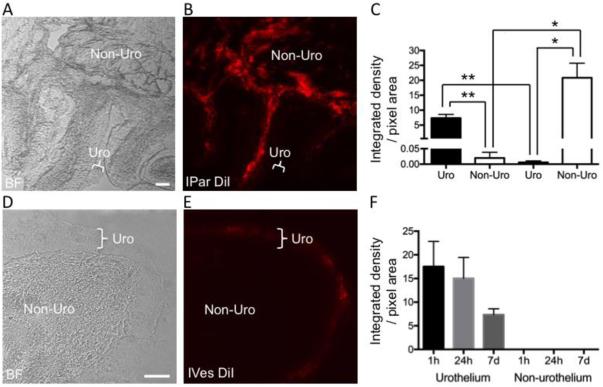
Figure 3. Fluorescent dye is differentially distributed in bladder tissue following IPar and IVes labeling.
Technique-dependent patterns of DiI distribution within the bladder were observed following IPar DiI injection and IVes DiI infusion. As seen in (A) and (C), non-urothelial bladder tissue (indicated by Non-Uro) could be differentiated from the urothelium (indicated by Uro) using bright field (BF) microscopy at 10× and 20×, respectively. The distribution of DiI in the same tissue sections (B, D) was quantified by determining the integrated density in urothelial and non-urothelial regions. In IVes-labeled mice, urothelial labeling was significantly greater than non-urothelial labeling, and in IPar-labeled mice, the opposite was true (C). Further, urothelial labeling was greater in IVes- than in IPar-labeled tissue, and non-urothelial labeling was greater in IPar- versus IVes-labeled tissue. The distribution of DiI in the bladder following IVes labeling did not change over time (F). * indicates P<0.05, ** indicates P<0.01.

