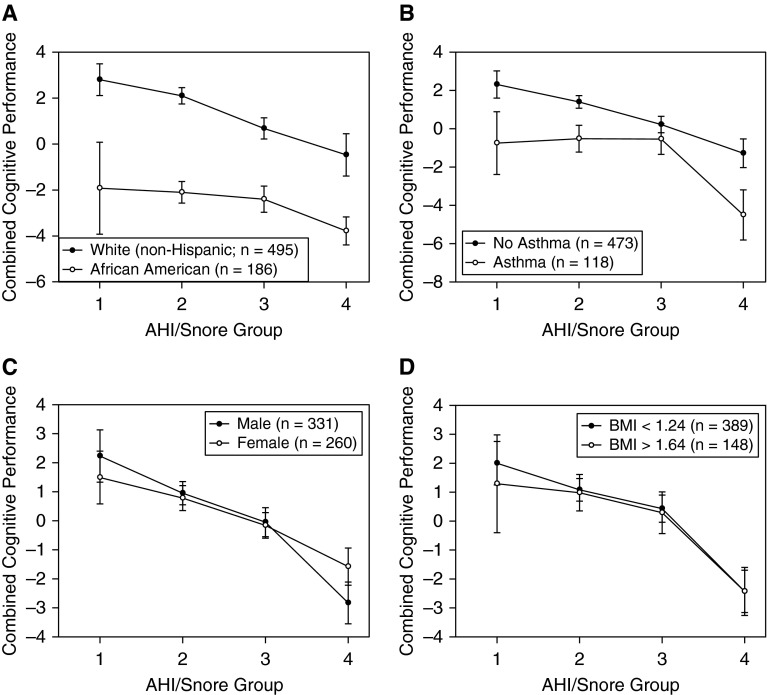
Figure 2.
Mean total cognitive performance across snore apnea–hypopnea index (AHI) groups by (A) race and/or ethnicity, (B) asthma status, (C) sex, and (D) body mass index (BMI). Error bars represent SE. Regression analyses using continuous AHI as a covariate illustrated that only the main effect for race was significant (P < 0.001; all other P > 0.05). No interaction terms with these variables and AHI were significant (P > 0.05). Numbers in parentheses represent regression analysis sample.

