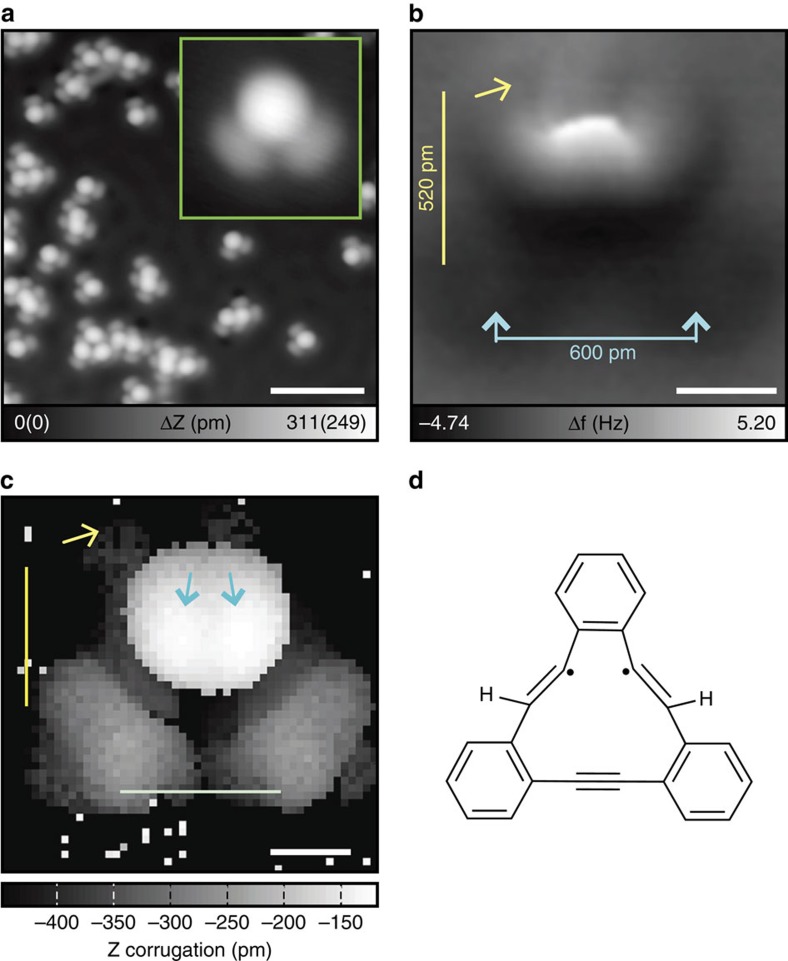
Figure 2. First reaction on Cu(111).
(a) Large-scale STM topography of tDBA as deposited on Cu(111) at 150 K. Inset shows the close view of the single molecule. (b) Corresponding AFM image, measured at a constant height. (c) Corrugation image, extracted via the three-dimensional frequency shift landscape. (d) Proposed chemical structure of the first product. Measurement parameters: Vtip=−200 mV and I=2 pA in a and Vtip=−200 mV and I=1 pA in (inset). Vtip=0 mV and A=60 pm in b,c. Scale bar, 4 nm in a. White, blue and yellow scale bars, 300 pm, 600 pm and 520 pm in b,c.

