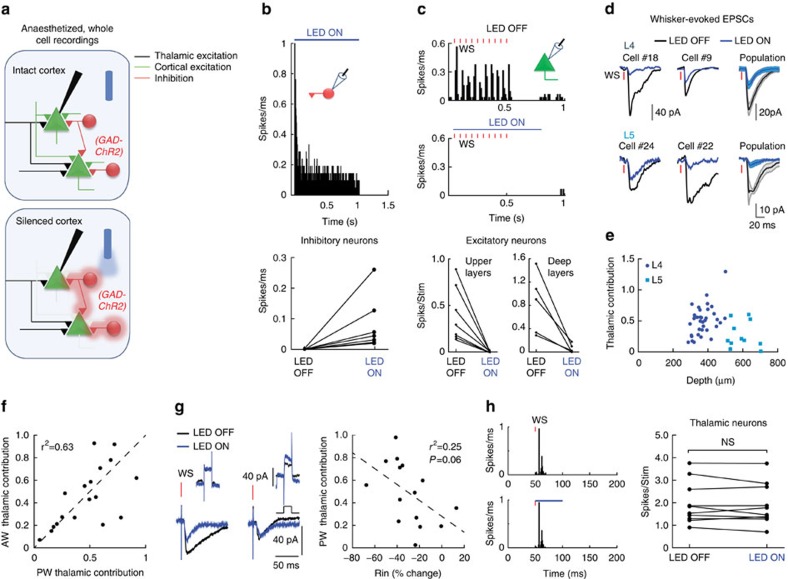
Figure 1. Optogenetic isolation of thalamic excitatory inputs to cortical neurons.
(a) Schematic illustration of cortical silencing experiments in anaesthetized mice. Light activates ChR2 expressing inhibitory cells, which in turn silence the firing of cortical cells. (b) Peri-stimulus spike time histogram (PSTH) for an example GAD+-ChR2 cell in response to 1 s LED illumination (top) and population mean firing rate of GAD/PV+-ChR2 cells (bottom). (c) PSTH of a putative excitatory L4 cell in response to repetitive whisker stimulation (red bars) in LED OFF and LED ON conditions (top) and population average spike count per stimulus of cells located in upper layers (bottom left) and deep layers (700–1,100 μM, bottom right). (d) Average whisker-evoked excitatory currents in two example L4 (left, top panel) and L5 (left, bottom panel) cells recorded independently during LED OFF and LED ON conditions and the population average currents (right). (e) Population depth profile of the thalamic contribution to evoked excitatory response of all recorded neurons (n=47). (f) The contribution of thalamic input for each cell, when the principal whisker (PW) or adjacent whisker (AW) was stimulated. (g) Average EPSC in response to 10 mV step (left, top panel) and whisker deflection in two recorded cells during LED OFF and LED ON (left, bottom panel) conditions. Right panel shows population thalamic contribution versus change in input resistance. (h) PSTH of a ventral posteromedial nucleus (VPM) neuron in response to whisker stimulation during LED OFF (left, top panel) and LED ON (left, bottom panel) condition. Right panel shows the population average spike count per stimulus of VPM cells.

