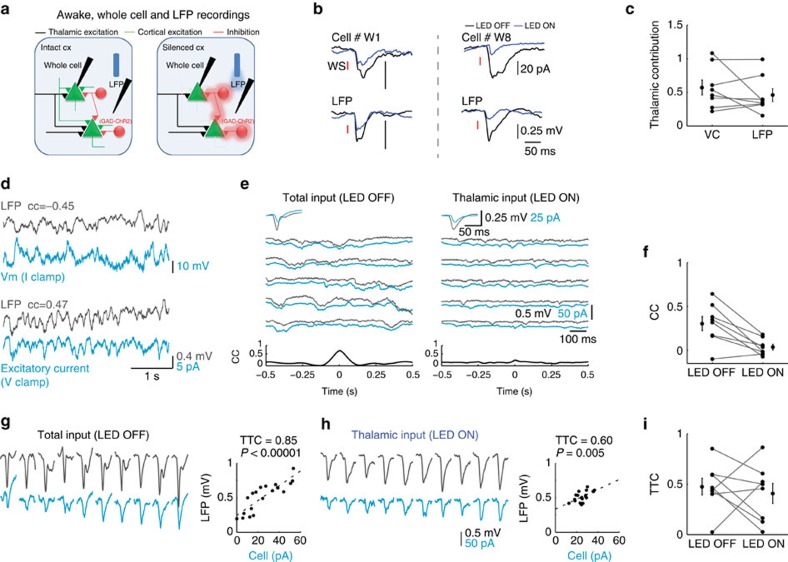
Figure 6. Ongoing and whisker-evoked correlations in awake mice are not determined by thalamic inputs.
(a) Schematic illustration of whole cell and LFP paired recordings in awake mice. (b) Average of paired recordings showing mean whisker-evoked EPSCs and LFP responses recorded from two animals. (c) Population data and mean peak EPSCs and the corresponding LFP response under LED OFF and LED ON conditions. (d) Simultaneous whole cell and LFP recordings in L4 during ongoing activity when the cell was recorded in current clamp and voltage clamp (at the reversal potential of inhibition) modes. (e) Example traces of ongoing excitatory currents in a L4 cell and the corresponding nearby LFP signal that was recorded simultaneously during LED OFF and LED ON conditions. Upper insets, average whisker-evoked EPSCs and LFP under the same conditions. Lower insets, cross-correlation between the cell and the LFP. (f) Population CC values for L4–LFP pairs n=8, P=0.01, Wilcoxon signed rank test). (g,h) TTCEL of EPSC–LFP paired recordings during LED OFF (g) and LED ON (h) conditions. Responses to 10 sequential whisker stimuli of one cell (light blue traces) sorted from the smallest to the largest amplitude with the corresponding responses of LFP (black traces). Scatter plots show peak LFP responses against the peak EPSC response of the cell. (i) Population data and averaged TTCEL for LED OFF and LED ON conditions in EPSP–LFP paired recordings (TTCEL=0.47±0.1 and 0.41±0.1, respectively, P=0.57 Wilcoxon signed-rank test, n=7).

