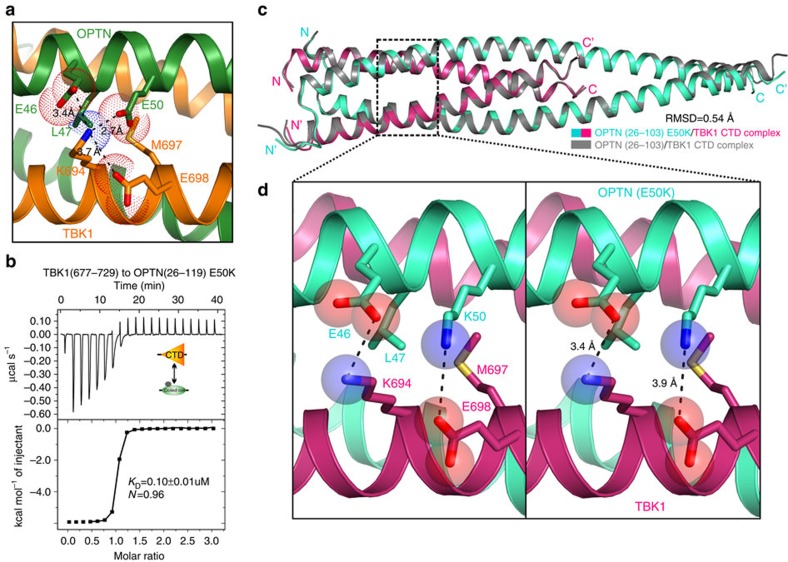
Figure 5. Mechanistic insights into the POAG-associated OPTN E50K mutation on the OPTN and TBK1 interaction.
(a) The combined ribbon and the stick-dot representations showing the detailed roles of OPTN E50 residue in the OPTN NTD and TBK1 CTD interaction. In this drawing, the side chains of key residues are shown in the stick mode, and the salt bridges, hydrogen bonds and charge–charge interactions are indicated by black dash lines. (b) The ITC-based measurement of the binding affinity of OPTN(26–119) E50K in binding to TBK1 CTD. The KD error is the fitted error obtained from the data analysis software, when using the one-site binding model to fit the ITC data. The measured N value is related to the binding stoichiometry. (c) Superposition ribbon diagram showing the comparison of the overall structures of the OPTN(26–103)/TBK1 CTD complex (grey) and the OPTN(26–103) E50K/TBK1 CTD mutant complex (colourized). (d) Enlarged stereo view showing the detailed structural role of OPTN K50 residue in the OPTN(26–103) E50K/TBK1 CTD mutant complex. In this drawing, the side chains of key residues are shown in the combined ribbon and stick-sphere mode, and the related hydrogen bonds, salt bridges and charge–charge interactions are indicated by black dash lines.

