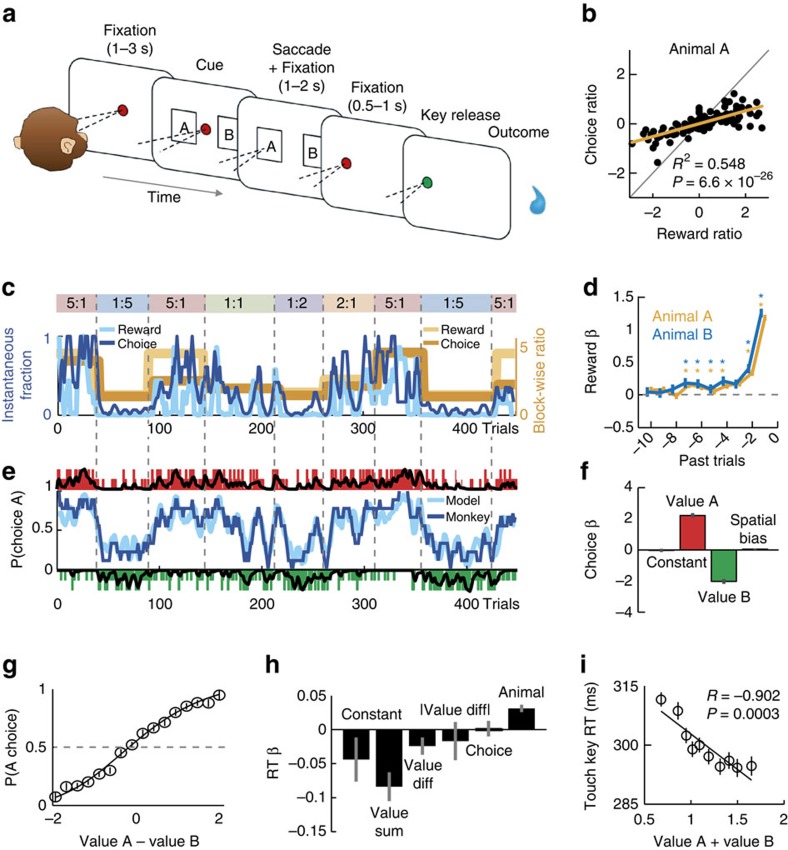
Figure 1. Foraging task and matching behaviour.
(a) Object-based foraging task. (b) Relationship between log-transformed choice and reward ratios across sessions. The base reward probability ratio was significantly related to the choice ratio (animal A: 11,040 trials from 139 sessions, t137=13.09, linear regression; data were similar for animal B: R2=0.740, P=4.7 × 10⁻²⁰; 5306 trials from 65 sessions, t63=13.37). (c) Behaviour in one example session: choices tracked relative reward probability. Dark blue curve: instantaneous fraction (7-trial running average) of object A choices. Light blue curve: instantaneous fraction of rewards received from object A. Yellow curves: block-wise reward (light) and choice (dark) ratios. Coloured boxes indicate block durations, numbers indicate reward ratios: object A to B. (d) Filters used to generate subjective object values: influence of past rewards on current-trial choice. Filters represent logistic regression weights derived from independent behavioural data (animal A: 5,520 trials, d.f.=5,499; animal B: 2,653 trials, d.f.=2,632). * P<0.05. (e) Model choices closely tracked the animal’s choices (same session as in (c)). Dark/light blue curve: running average of animal/model choices for object A. Vertical bars: animal choices for objects A (red) and B (green); long bars indicate rewarded trials. Black traces: subjective object values derived from weighted and summed reward and choice histories. (f) Out-of-sample prediction of choices from values. Logistic regression weights for object A value (P=1.3 × 10⁻²², t-test) and object B value (P=7.1 × 10⁻²⁰) and cue position (non-significant; coefficients pooled over animals and sessions; 102 sessions, t-test, d.f.=99). (g) Decision function relating value difference to choice probability (data pooled over animals and sessions). (h) Multiple regression of trial initiation times (key touch latencies) on value sum and covariates (12,358 trials, d.f.=12,352). Only value sum and animal coefficients were significant (both P<0.0001, t-test). (i) Single linear regression of trial initiation time on value sum (plot constructed by binning trials according to value sum and then determining reaction time means; data pooled over animals and sessions). Error bars show s.e.m.

