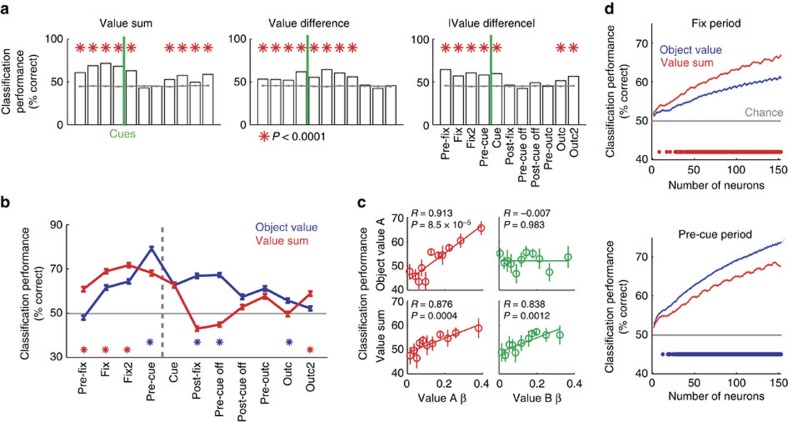
Figure 7. Population decoding of decision variables derived from object value.
(a) Performance (% correct, mean±s.e.m.) of a linear support vector machine classifier in decoding value sum, signed value difference and absolute (unsigned) value difference in different task periods (N=157 neurons). (b) Comparison of decoding performance for object value (blue data) and value sum (red data). The grey horizontal line indicates chance level. Red asterisks indicate significantly higher accuracy for value sum than object value (rank-sum test); blue asterisks indicate significantly higher accuracy for object value than value sum. (c) Relationship between decoding accuracy in individual neurons and neurons’ standardized object value regression coefficients, shown separately for object value A (upper panels, pre-cue period) and value sum (lower panels, fixation period). (d) Decoding performance as a function of neuron number for object value and value sum in fixation period (top) and pre-cue period (bottom). Asterisks indicate significant differences in decoding accuracy for object value and value sum.

