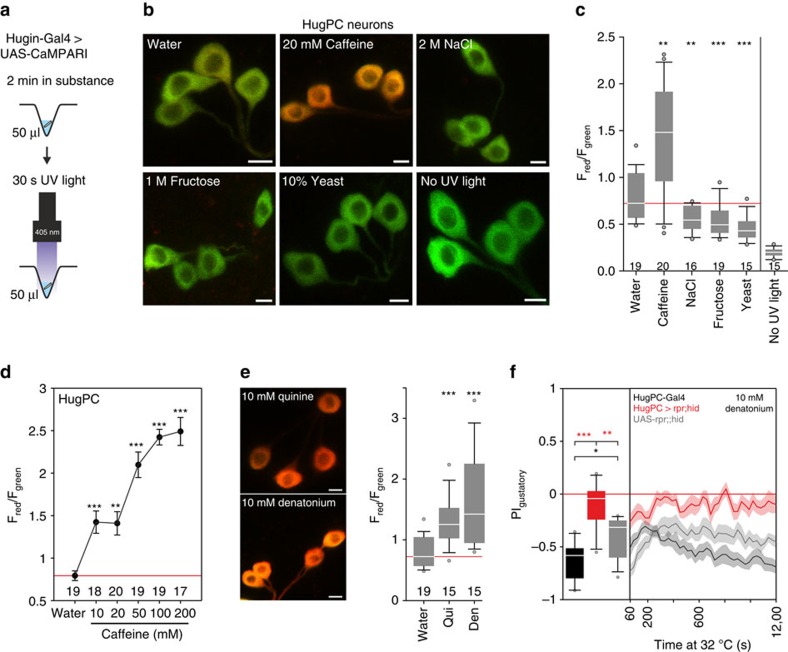
Figure 6. HuginPC neurons relay bitter taste information.
(a) Experimental setup (left panel). (b) Larvae expressing UAS-CaMPARI in huginPC neurons showed green to red photoconversion only when larvae were placed in caffeine solution. Scale bars, 5 μm. (c) Quantification of Fred divided by Fgreen for z-projections of huginPC neurons (P=0.003 for caffeine, P=0.004 for NaCl, P<0.001 for fructose and P<0.001 for yeast mixed in water compared with pure water, Mann-Whitney-U-Rank-Sum-Test (MWU-Test), n of larvae displayed beneath boxplots). Right most boxplot shows fluorescence ratio of huginPC neurons without ultraviolet light exposure (P<0.001, MWU-Test). (d) Measurement of huginPC neurons expressing UAS-CaMPARI in larvae confronted with different concentrations of caffeine. HuginPC neurons display increasing red/green ratio with increasing caffeine concentration (10 mM: P<0.001, 20 mM: P=0.003, 50 mM: P<0.001, 100 mM: P<0.001, 200 mM: P<0.001 compared with water alone, MWU-Test). Dots represent mean, whiskers represent s.e.m. (e) HuginPC neurons expressing UAS-CaMPARI display high calcium activity in 10 mM quinine (P<0.001, MWU-Test) or 10 mM Denatonium (P<0.001, MWU-Test). numbers beneath boxplots indicate number of larvae used for each experiment. Scale bars: 5 μm. (f) Two-choice assay with 10 mM denatonium. Ablating huginPC neurons with UAS-rpr;;hid (n=10) leads to impairment of gustatory choice on denatonium compared with HugPC-Gal4 control (n=10, P<0.001, MWU-Test) or UAS-rpr;;hid control (n=12, P=0.002, MWU-Test). Controls show significant difference to each other (P=0.027, MWU-Test). Boxplots were generated from PI values of the last 5 min of the 20 min experiment time for two-choice experiment. Significances are indicated as ***P<0.001, **P<0.01 and *P<0.05. Line plots showing the time course of the two choice experiment and dot plots are displayed as mean (line)±s.e.m. (transparent areas). Details of descriptive statistics and statistics against chance levels for experimental lines are shown in Supplementary Table 5.

