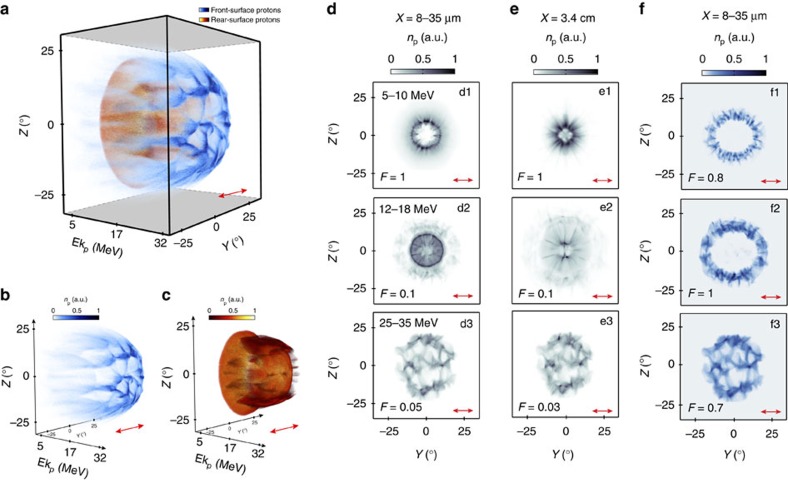
Figure 2. 3D-PIC simulation results showing the proton spatial-density distribution for linear polarization.
(a) Energy-resolved two-dimensional proton density distribution at X=8.5 μm. The blue and red distributions correspond to protons originating at the target front and rear surfaces, respectively. The same two distributions are plotted separately in (b) and (c) for clarity. (d) Combined (front and rear sourced) proton spatial-density distributions over the range X=8–35 μm, integrated over the stated energy ranges. (e) Projection of the combined proton density to X=3.4 cm (for comparison with experiment). (f) Proton distribution over the range X=8–35 μm arising only from protons sourced at the front side of the target foil. The colormaps are scaled by the stated value F to enable the features of interest at each energy slice to be clearly observed. The laser is polarized along the Y axis and the results in (d–f) are sampled at t=380 fs.

