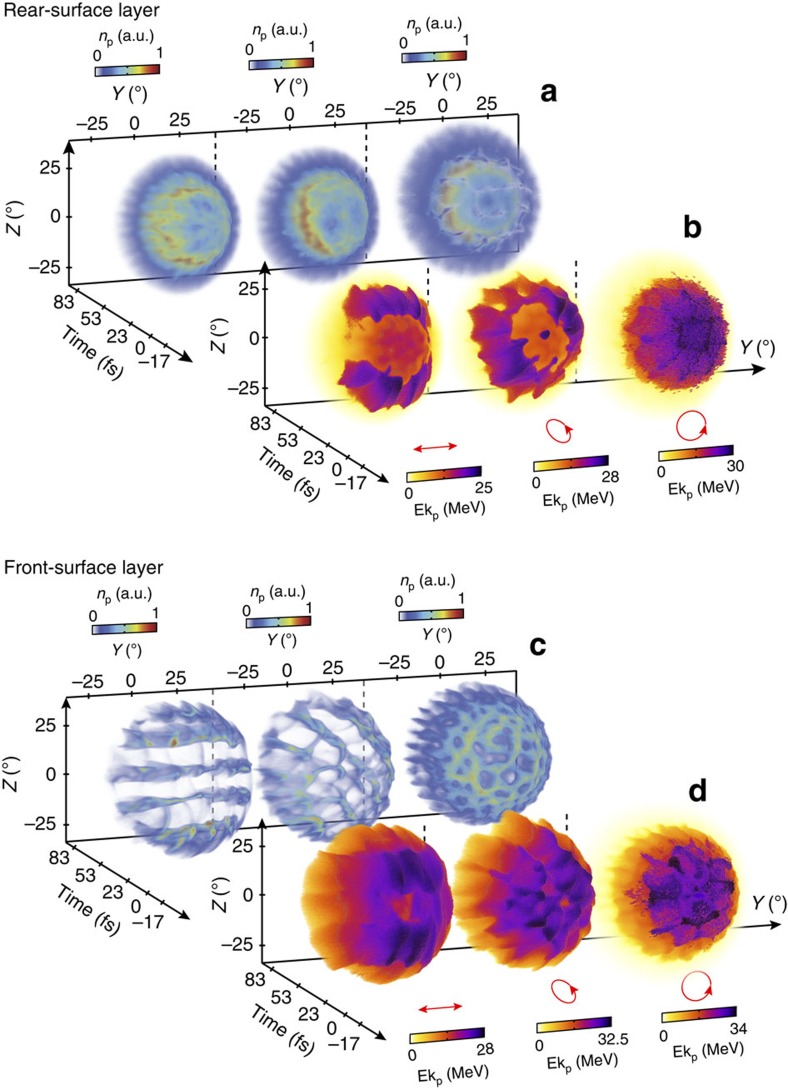
Figure 4. A comparison of spatial-density and kinetic energy distributions as a function of proton origin, with single-source layers.
Time-resolved (a) spatial-density distribution and (b) kinetic energy distribution, at X=3 μm, for all three polarization cases (as labelled with the small red arrows) for rear-surface protons. (c,d) Same, for protons originating at the target front surface.

