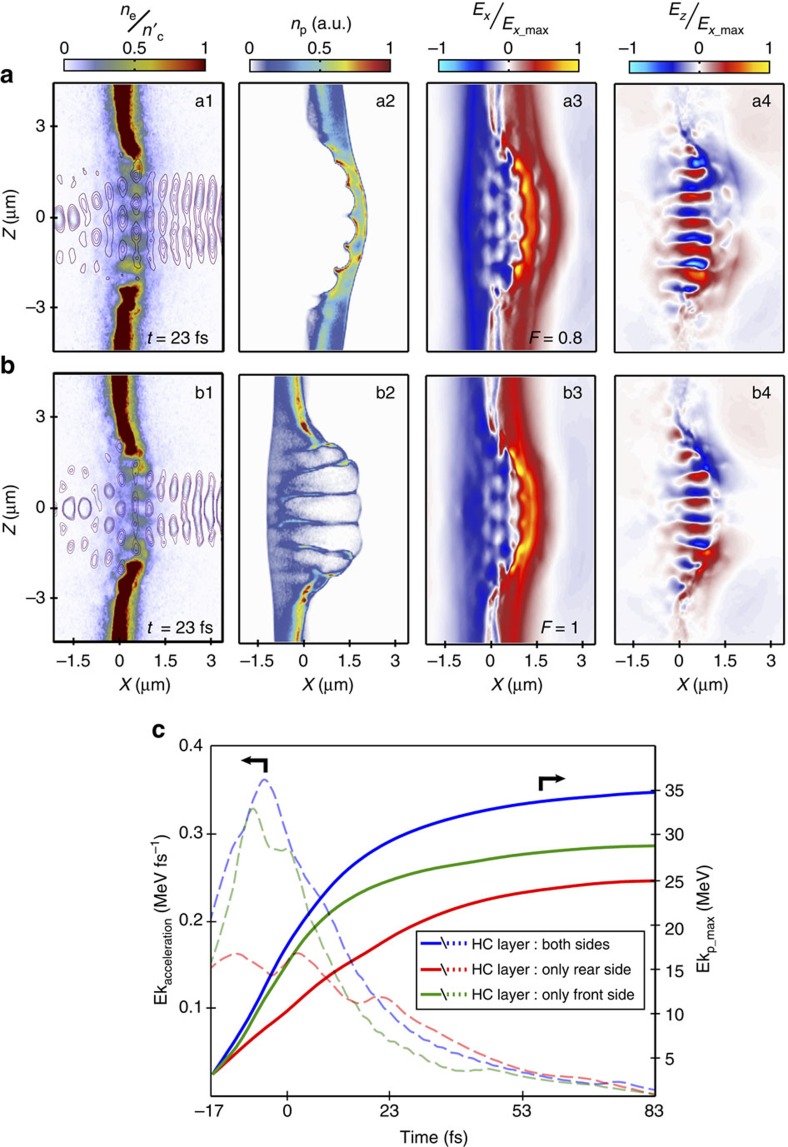
Figure 6. Comparison of electrostatic field and particle density distributions for front-only and rear-only proton sources.
(a,b) From left to right (as in Fig. 5): laser field contours and electron density; proton density; and longitudinal and transverse electrostatic field components, in the X–Z plane at Y=0 for hydrocarbon layer on the target (a) rear surface and (b) front surface. t=23 fs in both cases. (c) Evolution of the maximum proton energy (solid lines) and rate of change in kinetic energy (dashed lines) for three cases, corresponding to hydrocarbon layers on both surfaces (blue), only on the rear surface (red) and only on the front surface (green). In all cases the laser is linearly polarized along the Y axis.

