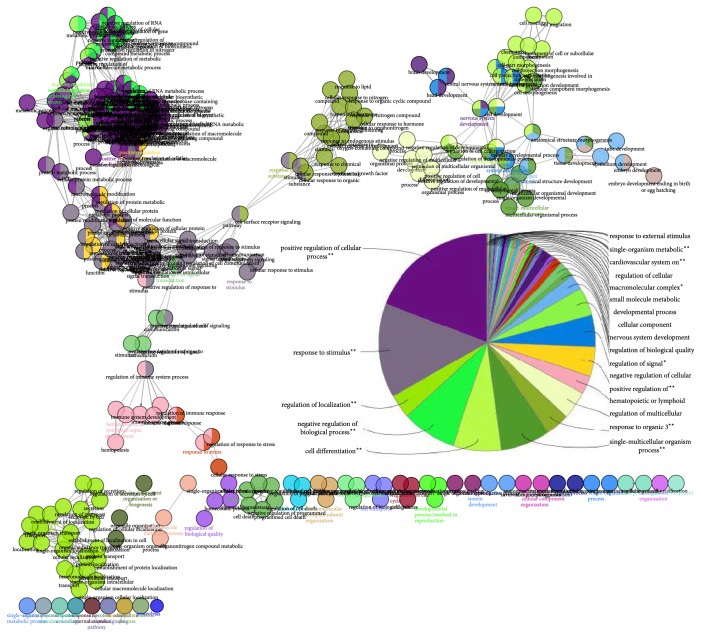
Figure 3.
Overrepresented GO categories in the integument gene list of human and mouse. The figure was drawn by Cytoscape 3.3.0 and shows enriched GO categories for common genes in three clusters. The pie chart shows the leading group term in each of the GO categories. The kappa score threshold was set to ≥0.5. ∗∗If the term/group is oversignificant (p value < 0.001). ∗If the term/group is significant (0.001 < p value < 0.05).

