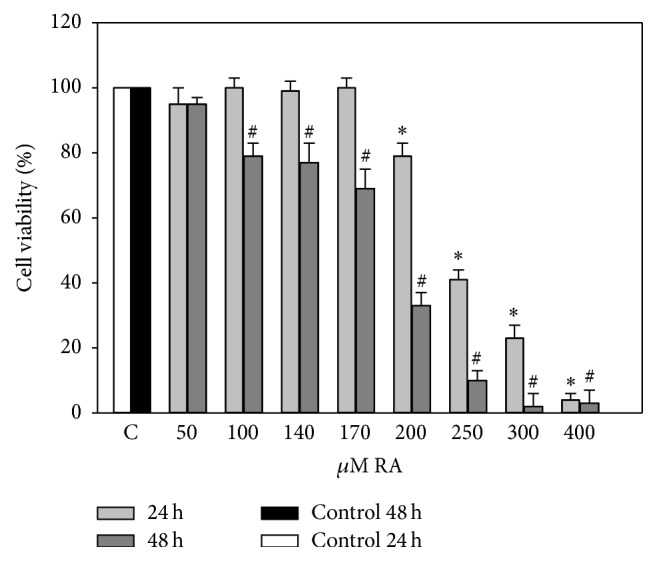
Figure 1.

Effects of different concentrations of RA on the viability of C6 cells. C6 cells were treated with different concentrations (50–400 μM) of RA for 24 and 48 hours. Cell viability was assessed using MTT method. Data are presented as means of percentage of the untreated control cells ± SE (n = 5). ∗ p < 0.05 versus control 24 h, # p < 0.05 versus control 48 h.
