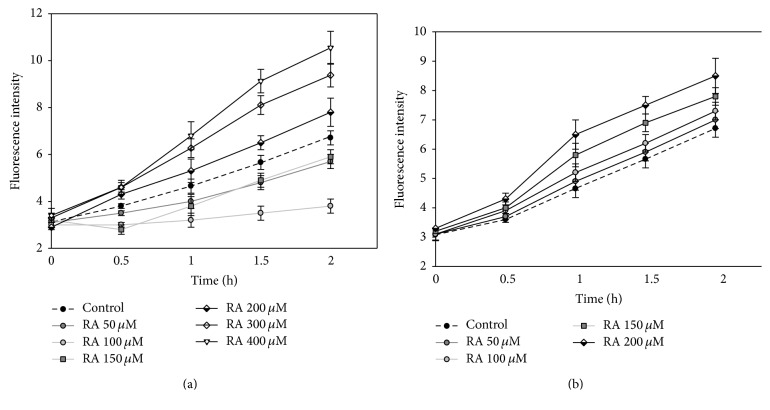
Figure 6.
The effect of (a) RA and (b) N1 extract on concentration of intracellular RS. C6 cells were pretreated with 10 μM DCFH-DA and then treated with different concentrations of RA and aqueous extract N1 for 0; 0.5; 1; 1.5; and 2 hours. Fluorescence intensity, which is proportional to intracellular RS concentration, was detected by using a fluorometer at excitation and emission wavelengths of 488 and 525 nm, respectively. Data is presented by fluorescence intensity ± SE (n = 3).

