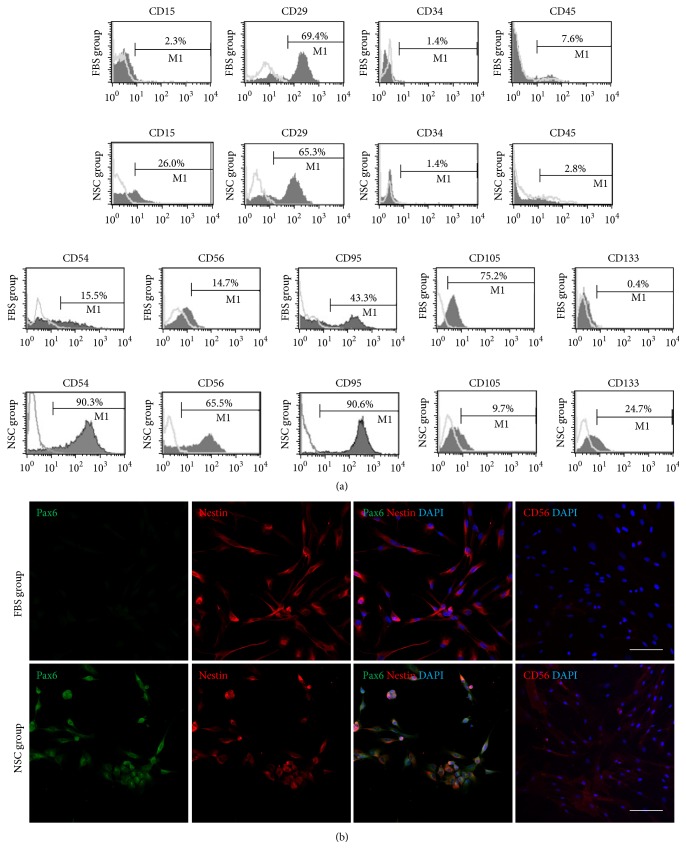
Figure 4.
FACS analysis and immunocytofluorescence of FBS and NSC groups. (a) Expression of surface markers in FBS and NSC groups at passage 5 as analyzed by FACS. The NSC markers (CD15, CD29, CD54, CD56, and CD95), MSC marker (CD105), and hematopoietic markers (CD34, CD45, and CD133) in the FBS and NSC medium cells. (b) Immunocytofluorescence findings of FBS and NSC medium cells at passage 5. The cells were stained with Pax6, nestin, and CD56. Scale bar = 100 μm.

