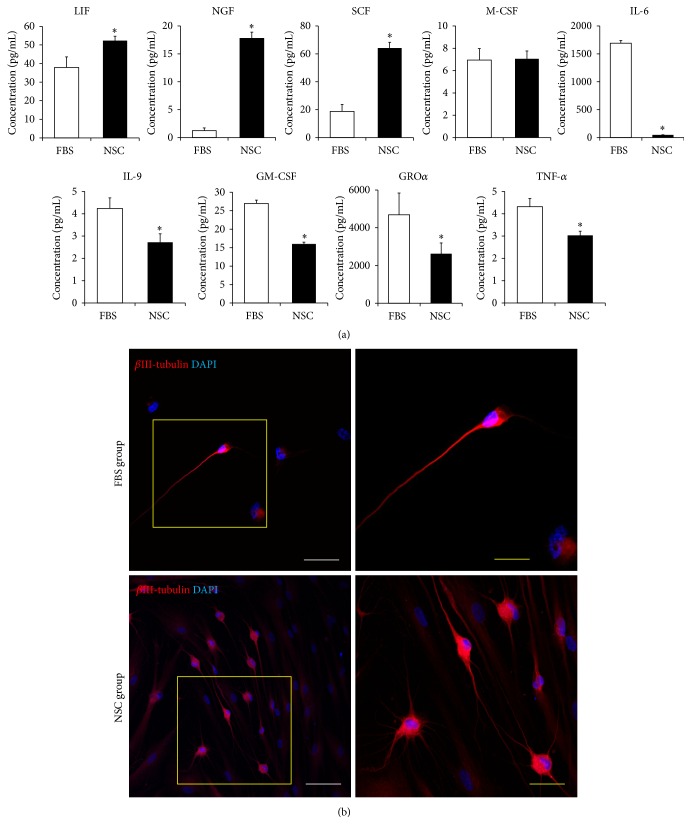
Figure 5.
Growth factors, cytokine-secretion capacity, and neural differentiation potency. (a) Multiplex supernatant cytokine assay in FBS group (FBS, white bar) and NSC group (NSC, black bar) at passage 5. The error bars represent the standard deviation of mean from three donors in each group (n = 3). The asterisk (∗) indicates significant difference in comparison with the FBS group according to the independent t-test (P < 0.05). (b) Immunocytofluorescence findings of FBS and NSC medium cells after 3-week procedure for differentiation to neural-like cells. βIII-Tubulin positive cells were stained in red, and nuclear counterstaining was performed with DAPI (blue). White scale bars = 100 μm; yellow scale bar = 50 μm.

