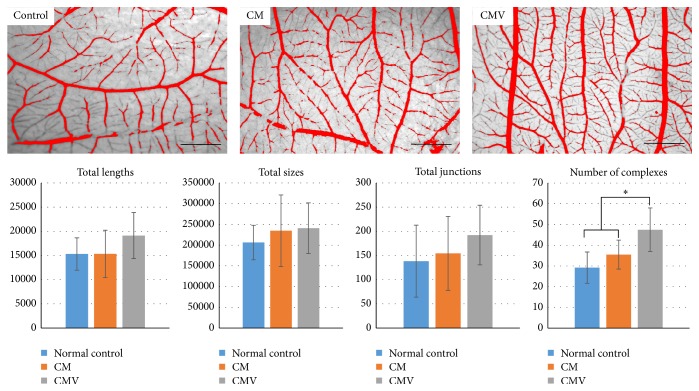
Figure 5.
Representative images of blood vessel networks formed in the CAM model after 4 days of sample placement in contact with embryos (×10, bar = 200 μm). Image analysis represents total length, total size, total junction, and number of complexes of blood vessels for control, CM, and CMV group (mean ± standard deviation, ∗ p = 0.00002 compared to CMV).

