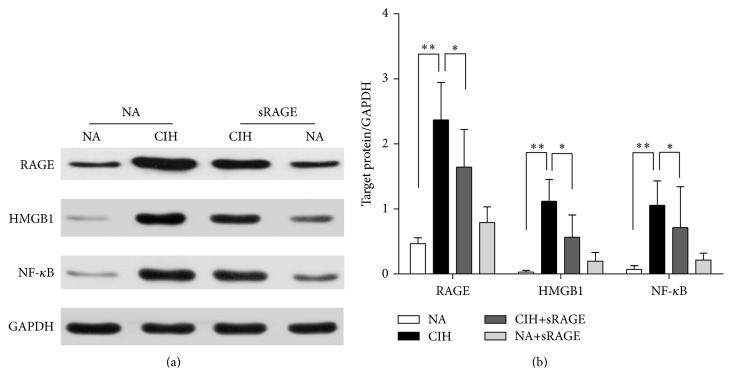
Figure 4.
Effect of sRAGE on expressions of RAGE, HMGB1, and NF-κB. (a) Representative western blot images (upper panel) and GAPDH (lower panel) used as the endogenous control are shown in each group. (b) Quantification densitometric analysis summarizes the fold changes of protein levels normalized to GAPDH. Data are expressed as means ± SEM. ∗ P < 0.05, ∗∗ P < 0.01; n = 6/group.

