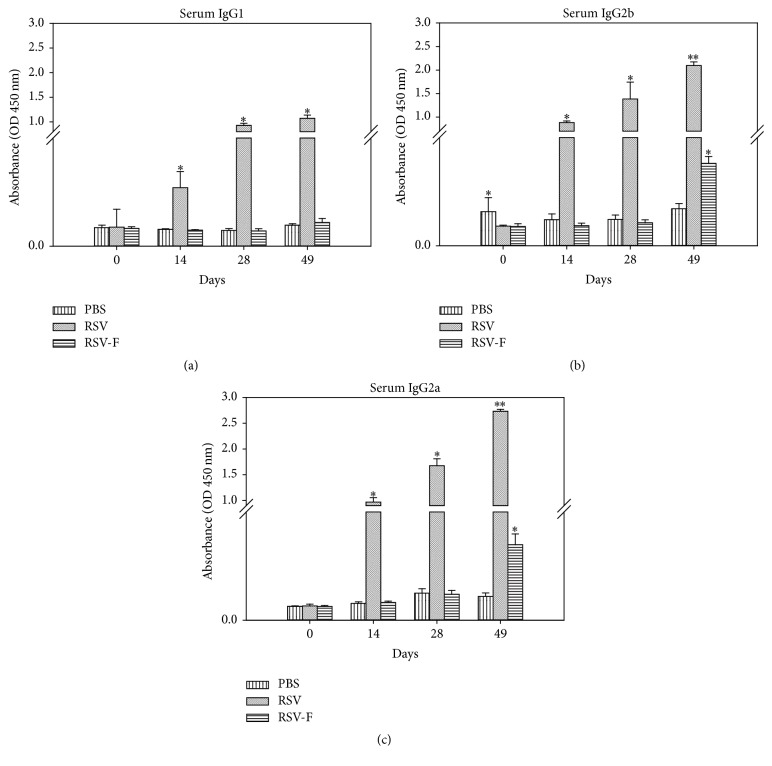
Figure 5.
IgG isotypes; (a) IgG1, (b) IgG2b, and (c) IgG2a antibody response against RSV specific antigens. Serum samples (PBS, RSV infected, and PF DNA-immunized mice) were collected from BALB/c mice on days 0, 14, 28, and 49 and IgG isotypes were detected by ELISA. Data is presented as an average of triplicates performed twice; error bars represent standard deviations. ∗Significantly different (P < 0.01) from PBS group; ∗∗significantly different (P < 0.01) from PBS and PF DNA groups. P values (P < 0.01) were calculated using ANOVA, Tukey's test.

