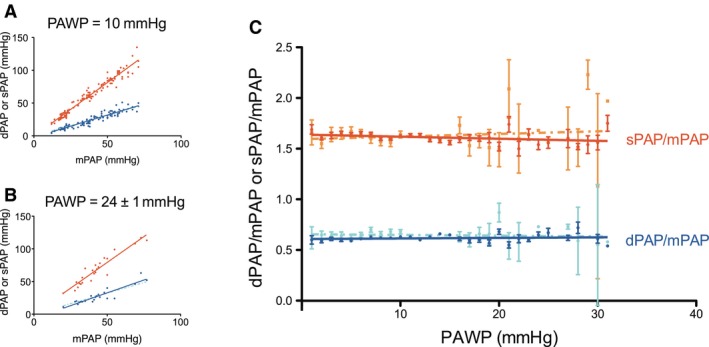
Figure 3.

(A–B) The relation of sPAP and dPAP with mPAP in patients with a PAWP of 10 mmHg (n = 115) and of 24 ± 1 mmHg (n = 24). The relations with intercept (lighter dashed lines) and without intercept (continuous lines) nearly completely overlap. (C) The ratio of sPAP and dPAP relative to mPAP, as function of PAWP; standard errors are indicated.
