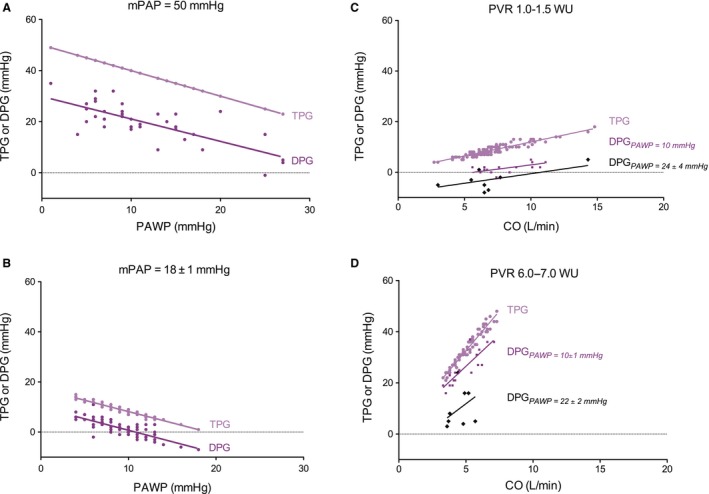
Figure 4.

(A–B). Relations between transpulmonary pressure gradient (TPG) and diastolic pressure gradient (DPG) as a function of PAWP, for a low (A, n = 77) and high (B, n = 38) value of mPAP. All slopes do not differ from the predicted slope‐1. (C–D) Relations between TPG and DPG and cardiac output (CO), for two different values of pulmonary vascular resistance (PVR): (C) Average PVR = 1.2 Wood units (WU). TPG, n = 106; DPG and PAWP 10 mmHg, n = 16; DPG and PAWP 24 ± 4 mmHg, n = 9; (D) Average PVR =6.5WU. TPG, n = 67; DPG and PAWP 10 ± 1 mmHg, n = 18 DPG and PAWP 22 ± 2 mmHg, n = 9. Slopes of TPG are equal to PVR. Slopes of DPG are not different from the predicted 0.62PVR. The intercepts with the vertical axis do not differ from the predicted −0.38PAWP.
