
Figure 2.
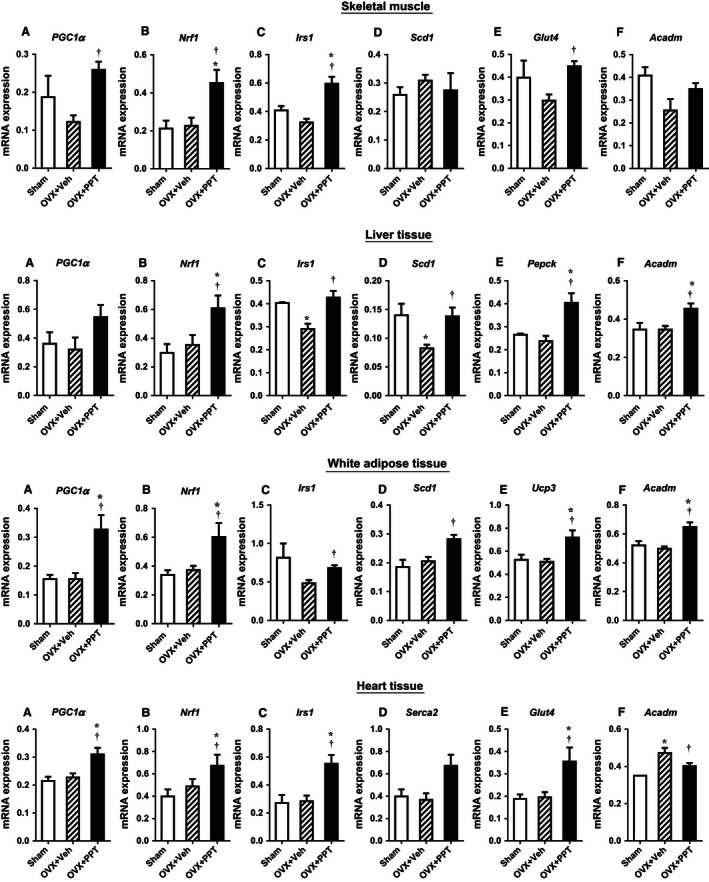
PPT treatment impact mitochondrial and glucose and fatty acid metabolism genes in OVX mice. mRNA expression for heart, liver, skeletal muscle, and white adipose tissue as measured by quantitative RT‐PCR. (Data shown as mean ± SEM; N = 3 sham, 4 OVX + Veh, and 6 OVX + PPT. †P < 0.05 vs. OVX + Veh by Mann–Whitney test).