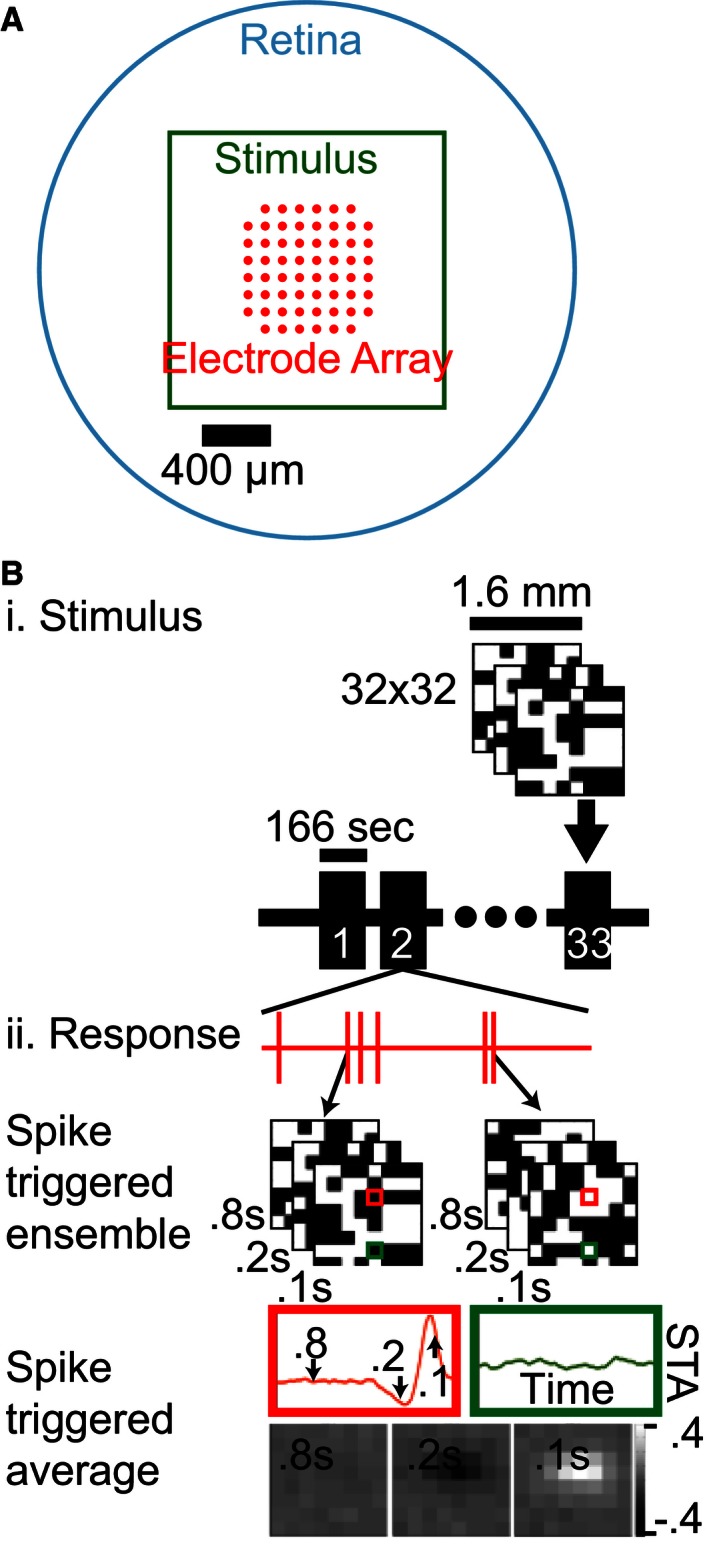
Figure 1.

Recording and stimulation of ganglion cells. (A) An explanted mouse retina (cyan) was placed on a multielectrode array (red) ganglion cell side down and stimulated with an optically reduced monitor image (green). (B) i: The stimulus was an iterated sequence of 32 × 32 binary white noise checkerboards (8 × 8 illustrated). ii: Spiking responses of individual cells were identified and used to calculate the average stimulus that triggered a spiking response, the spike‐triggered average (STA). The resulting receptive field map had a space–time structure which can be illustrated as a temporal filter for each spatial point (red and green highlights) or as a spatial filter at a single temporal slice (bottom).
